
Figure 3.
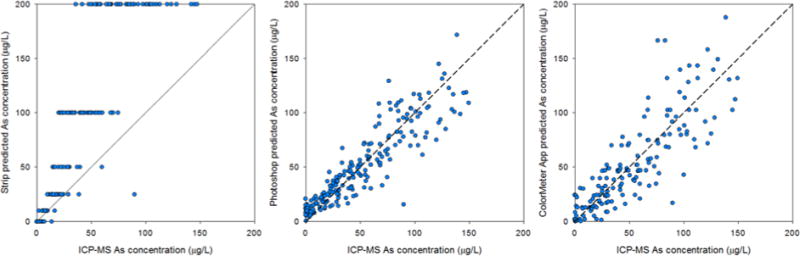
Cross validation plots showing the comparison of field measured categorical As concentrations (left), Photoshop predicted field concentrations (center) and ColorMeter-predicted concentrations (right) compared to As concentrations measured by ICP-MS.