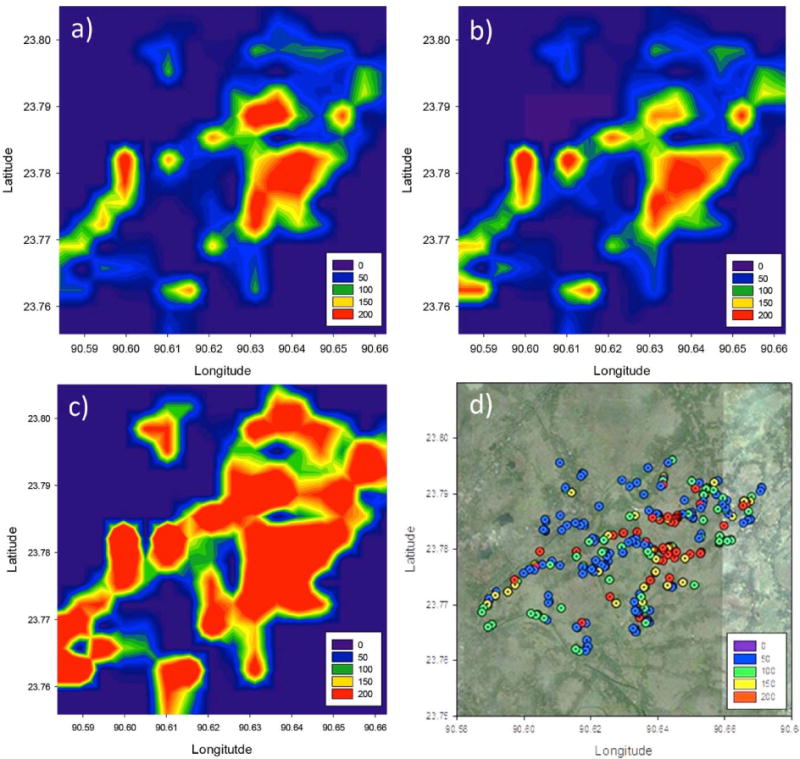
Figure 4.

Contour plots of a) ICPMS determined b) field kit photo predicted and c) field kit strip predicted As concentration expressed in μg/L. The location and As concentrations of wells sampled are displayed in d. Well with depths >50 m are not shown.
