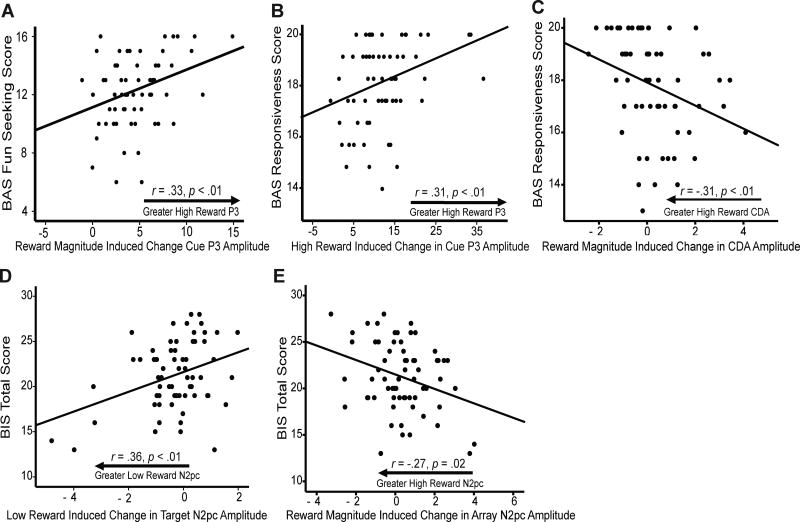
Figure 4.
Scatterplots of BIS/BAS scores and the ERP measures that were significant predictors of those scores in regression models. ERP amplitudes in microvolts (µV). A) BAS Fun Seeking score by reward magnitude (i.e. high – low) induced change in P3 to the reward cue. B) BAS Reward Responsiveness score by high reward induced change in P3 to the reward cue. C) BAS Reward Responsiveness score by reward magnitude induced change in CDA. D) BIS score by low reward induced change in N2pc to the target. E) BIS score by reward magnitude induced change in N2pc to the search array.

