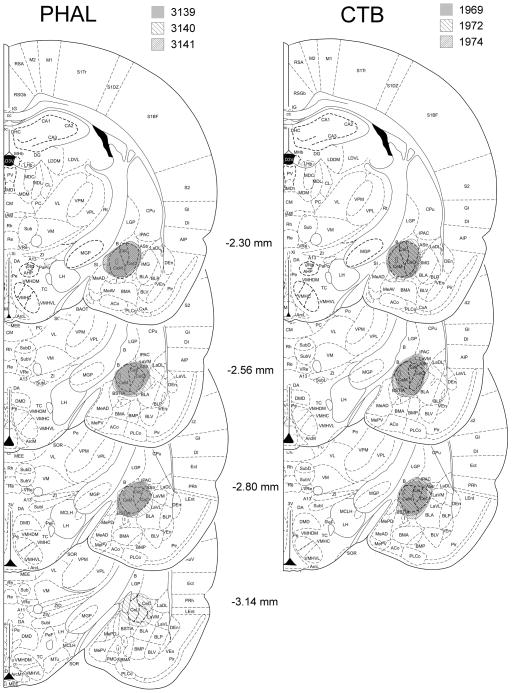
Figure 5.
Schematic representation of the core of CTB and PHAL injection sites within the CEA in 3 or 4 anteroposterior levels, respectively. The injection sites were mapped to planes of the Paxinos rat brain atlas (Paxinos and Watson 1998). Case numbers and the pattern demonstrating the boundaries of each injection core are indicated above the images.

