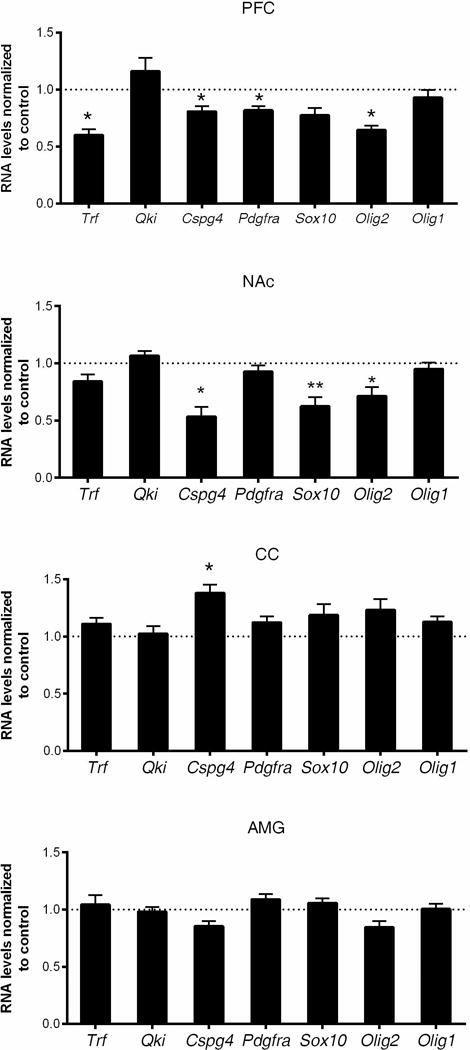
Figure 3. Chronic variable stress induces transcriptional changes in oligodendrocyte-specific genes in the adult mouse brain.

Quantitative RT-PCR of oligodendrocyte-specific gene transcripts in (A) prefrontal cortex (PFC), (B) nucleus accumbens (NAc), (C) corpus callosum (CC) and (D) amygdala (AMG). Bar graphs indicate average values in stressed mice after Gapdh normalization relative to average control levels (dashed line) (n=5–6 mice per group, two-tailed unpaired t-test, * FDR < 0.05, ** FDR < 0.01). Note the decreased oligodendrocyte-specific gene transcripts in the PFC and NAc, while increased oligodendrocyte progenitor gene transcript (i.e., Cspg4) in the corpus callosum (CC). Data represented as mean ± S.E.M.
