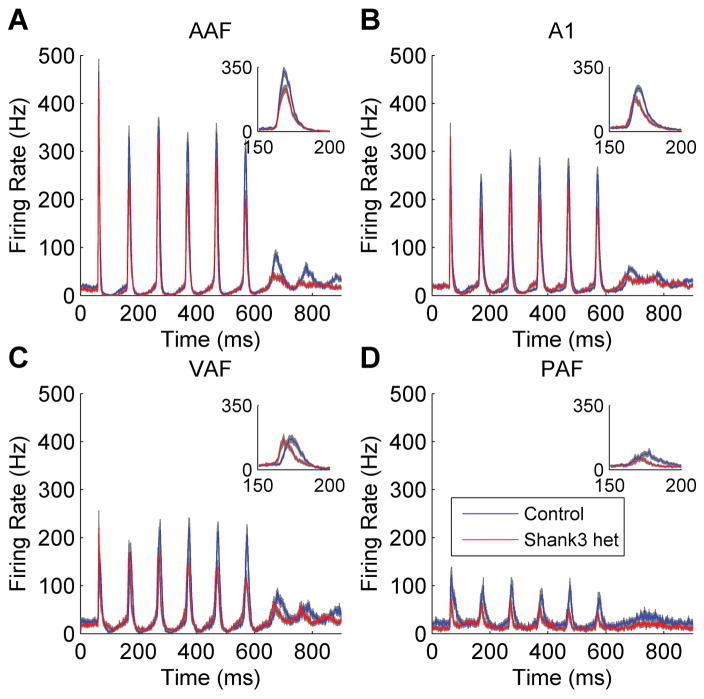
Figure 1.
The auditory cortex response to rapidly presented noise burst trains was altered in Shank3 heterozygous rats. The post-stimulus time histogram (PSTH) response to a train of 6 noise bursts presented at 10 Hz (interstimulus interval of 100 ms) is shown in (a) AAF, (b), A1, (c) VAF, and (d) PAF. The gray shading indicates SEM across recording sites. The figure inset displays a zoomed in version of the response to the second noise burst.

