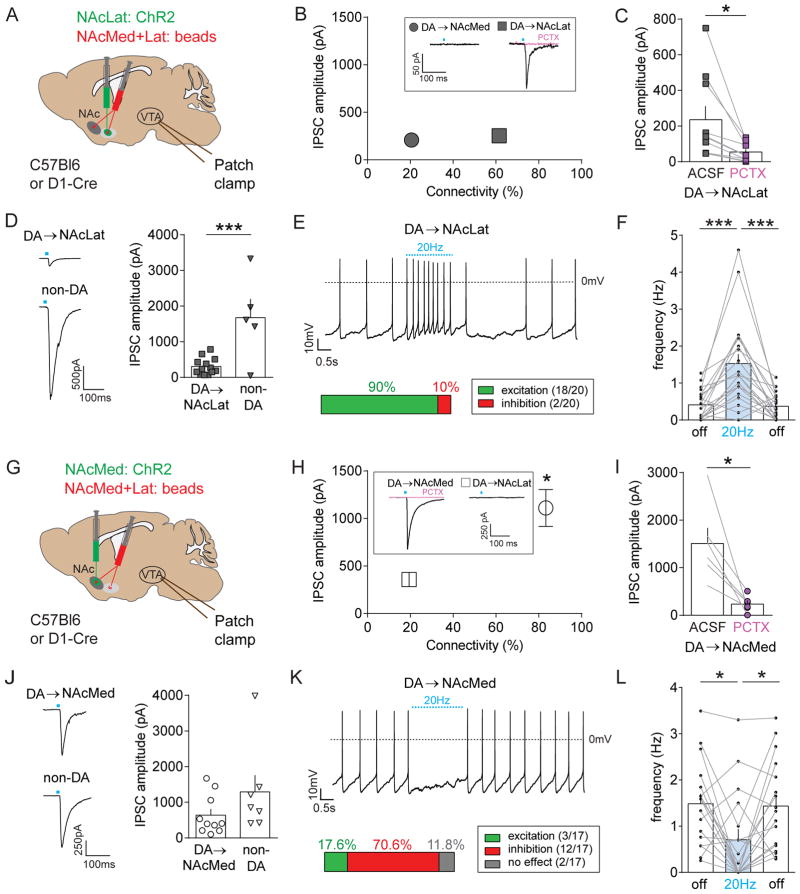
Figure 3. Optogenetic stimulation of discrete NAc inputs to the VTA reveals opposing effects in different mesolimbic DA subpopulations.
(A) Schematic of AAV injection into the NAcLat and red retrobead injection into the NAcLat and NAcMed of C57Bl6 (for experiments shown in panels B and C) or D1-Cre mice (for experiments shown in panels D–F). Whole-cell patch clamp recordings were performed from retrogradely labeled neurons in different VTA subregions while optogenetically stimulating NAcLat terminals in the VTA.
(B) Synaptic connectivity plotted against the amplitude of light-evoked inhibitory postsynaptic currents (IPSCs; recorded in 20 μM CNQX, 50 μM D-AP5, 1 μM TTX, 1 mM 4-AP) from NAcMed- (grey circle) and NAcLat-projecting (grey square) DA neurons. Inset shows sample trace of a light-evoked IPSC from a NAcLat-projecting DA neuron (black trace), which are blocked by bath application of 50 μM picrotoxin (red trace). Note that relatively few (~20%) of NAcMed-projecting DA neurons responded to NAcLat terminal stimulation. Error bars are too small to resolve. (Data represent means ± SEM).
(C) Bar graph showing mean IPSC amplitudes before (ACSF) and after bath-application of 50 μM picrotoxin (PCTX) in NAcLat-projecting DA neurons (* p < 0.05) (Data represent means ± SEM).
(D) Sample traces showing light-evoked IPSCs recorded in NAcLat-projecting DA neurons and non-DA VTA neurons when stimulating NAcLat terminals in the VTA (left). Bar graph showing significantly larger IPSC amplitudes in non-DA neurons compared to NAcLat-projecting DA neurons (right) (*** p < 0.001) (Data represent means ± SEM).
(E) Sample whole-cell patch clamp recording of spontaneous firing in NAcLat-projecting DA neuron and 20 Hz stimulation of NAcLat terminals. Bar chart indicates the percentage of cells that were excited (i.e., increased firing frequency) or inhibited (i.e., decreased firing frequency) in response to NAcLat stimulation.
(F) Bar graph showing the mean firing frequency of NAcLat-projecting DA neurons before (light off), during (light on, 20 Hz) and after (light off) stimulation of NAcLat terminals in the VTA (*** p < 0.001) (Data represent means ± SEM).
(G–L) Same experimental approach as in (A–F), but for analyzing NAcMed inputs to NAcLat- and NAcMed-projecting DA neurons. Note the strong synaptic connectivity between the NAcMed and NAcMed-projecting DA neurons (H), the inhibition of light-evoked IPSCs by PCTX (I) and inhibition of spontaneous firing in the majority of NAcMed-projecting DA neurons in response to NAcMed terminal stimulation (K, L) (* p < 0.05) (Data represent means ± SEM).

