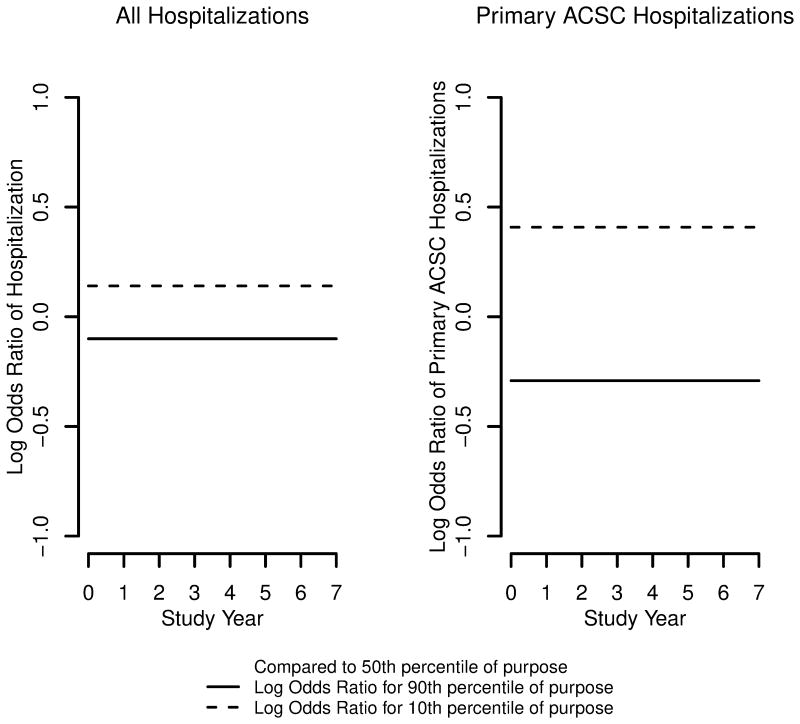
Figure 3.
Log odds ratio of hospitalizations per year for those with high (90h percentile, solid line) or low (10th percentile, dashed line) purpose in life compared to those with median purpose (50th percentile), from proportional odds models adjusted for age, sex, and education, vascular risk factors, vascular conditions, depressive symptoms, and early life socioeconomic status.

