Figure 2.

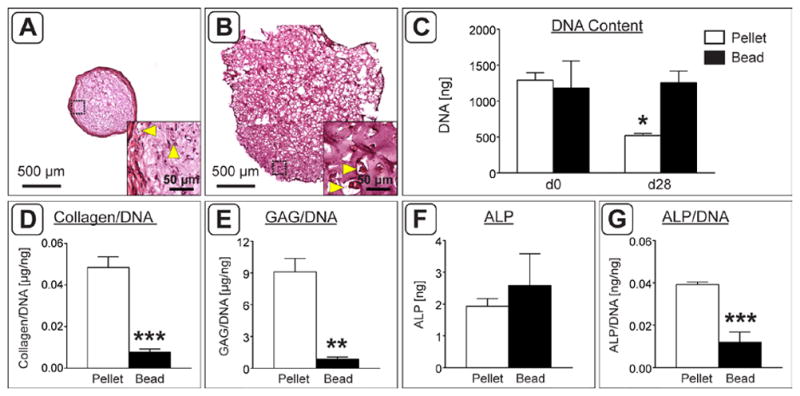
Implant size and biochemical analysis at the time of implantation. A,B) H&E staining of pellet (A) and alginate bead (B) constructs following 4 weeks of chondrogenic induction in vitro. Black dashed boxes indicate the region magnified in insets. Yellow arrowheads indicate the presence of enlarged cells with a hypertrophic morphology. C) Starting DNA content (d0) compared to DNA content after 4 weeks in culture (d28). Pellets at 28 days contained significantly fewer cells than all other groups. D) Total collagen content normalized to the average DNA content. E) sGAG content of each construct normalized to its DNA content. F,G) Total ALP activity (F) and ALP activity normalized to DNA content (G). (n = 3; *: p < 0.05, **: p < 0.01, ***: p < 0.001, ****: p < 0.0001).
