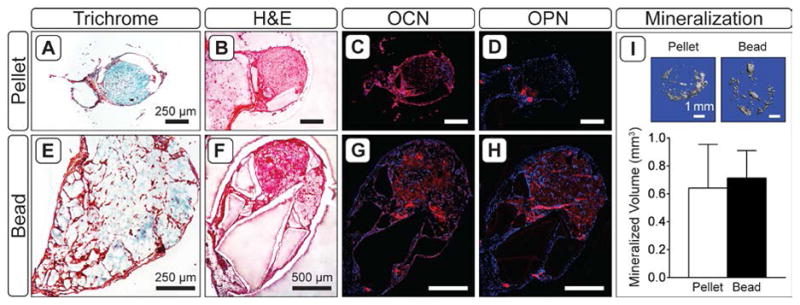
Figure 4.

Tissue morphology by Masson’s Trichrome (A,E) and H&E (B,F), and osteogenic markers (C,G; D,H) in 8 week explants. For osteocalcin (C,G) and osteopontin (D,H), red staining indicates the marker of interest; blue staining indicates cell nuclei (DAPI). I) 3-D renderings of calcified tissue in pellet and bead explants, and average volume of mineralized tissue in explants as assessed by μCT (n = 5).
