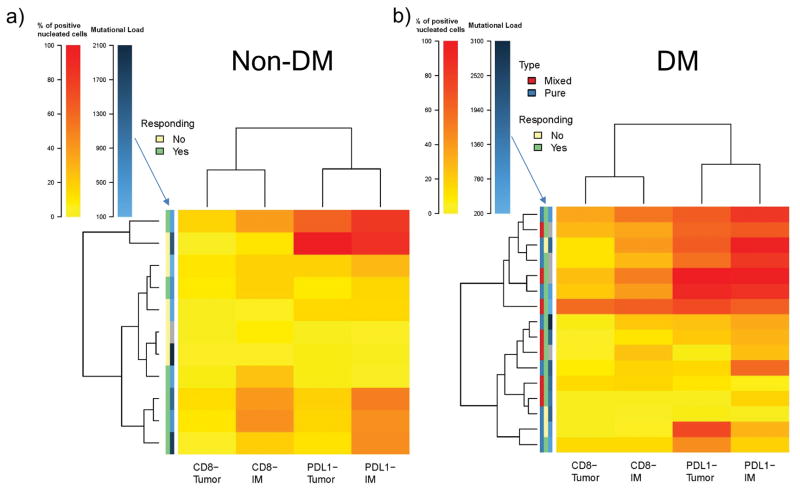
Extended Data Figure 8. Hierarchical clustering of cases of desmoplastic melanoma and non-desmoplastic cutaneous melanoma based on CD8 and PD-L1 expression in the invasive margin and tumour parenchyma.
A) Non-desmoplastic cutaneous melanomas (n=13), with the y axis colour coded for response and mutational load. B) Desmoplastic melanomas (n=19), with the additional information of differentiation between pure (red) and mixed (blue) histology in the y axis. For mutational load, darker squares correspond to higher mutational load. Gray squares are missing data points.

