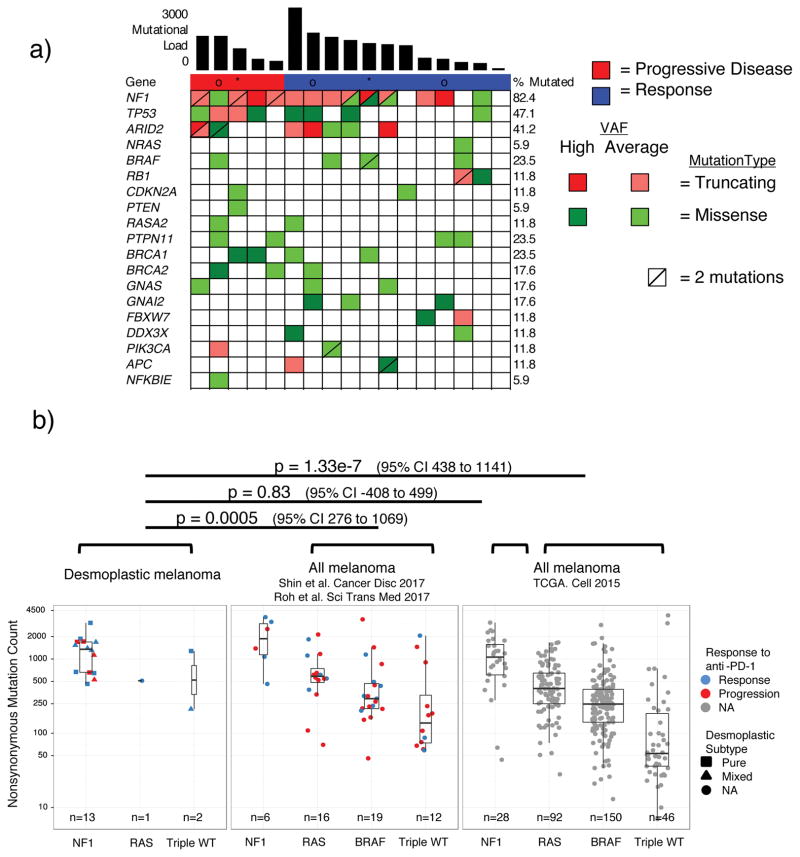
Figure 2. High mutational load and similarity to NF1 subtype in desmoplastic melanoma (DM).
A) Top bar graph represents mutational load. Tiling plot shows mutations in a given gene (rows) per sample (columns). In the tiling plot, top line represents response, as either primary resistance/progressive disease (red), n=5, or response (partial or complete response and stable disease > 12 months, dark blue), n=12. Colour indicates mutation type, with truncating mutations (frameshift, nonsense, splice-site) in red, missense in green, and synonymous in beige. Darker colour intensity indicates potentially homozygous mutations, with variant allele frequency >1.5 times the sample median. * = biopsy from responding lesion despite a mixed response and eventual progression. o = patient showed no evidence of disease for > 1year after surgical resection of a progressing lesion. B) Non-synonymous mutations determined by whole exome sequencing (WES) from the current DM cohort, two pooled studies of anti-PD1 treated cutaneous melanoma14,15 and TCGA data. Each cohort is split by driver mutation subtype, colour indicates PD1 blockade therapy response (red = progression, blue = response), and shape represents desmoplastic pure vs mixed subtype. In the box plots, line = median, box = 25th/75th percentile, whiskers = highest/lowest value within 1.5*interquartile range. P values = two-sided Wilcoxon-Mann-Whitney rank sum test.

