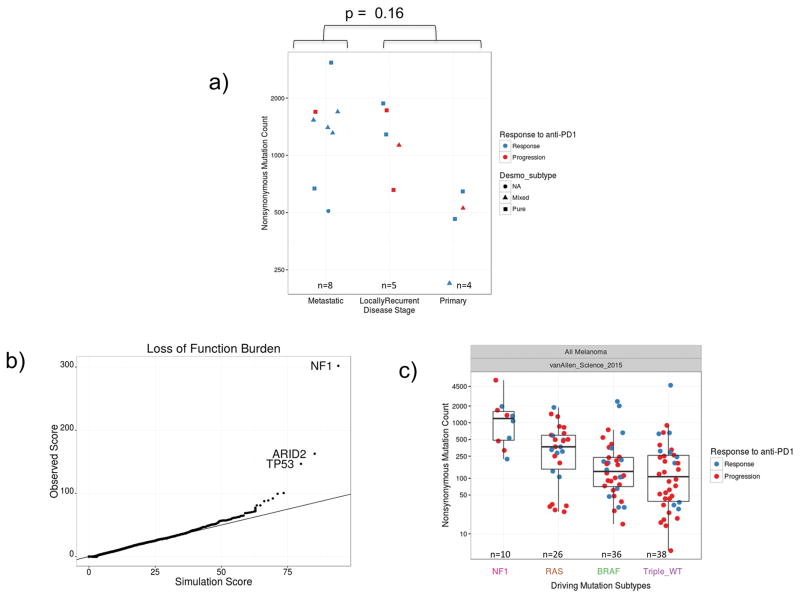
Extended Data Figure 3. Mutational analysis in the desmoplastic melanoma cohort.
A) Analysis of mutational load in samples obtained from primary locally advanced cases and metastatic lesions. Two sided Wilcoxon-Mann-Whitney rank sum test, p = 0.16 (95% CI −171 to 1175). B) Scores from the loss-of-function (LOF) SigRank algorithm1 show enrichment for LOF mutations (nonsense, frameshift, splice-site or damaging missense) compared to the expected number based on the rate of LOF mutations in the cohort. Solid line corresponds to observed/expected ratio of 1.0. C) Mutational load in the vanAllen16 anti-CTLA4 treated cohort separated by driver subtype and coloured by response. In the box plots, line = median, box = 25th/75th percentile, whiskers = highest/lowest value within 1.5*interquartile range.

