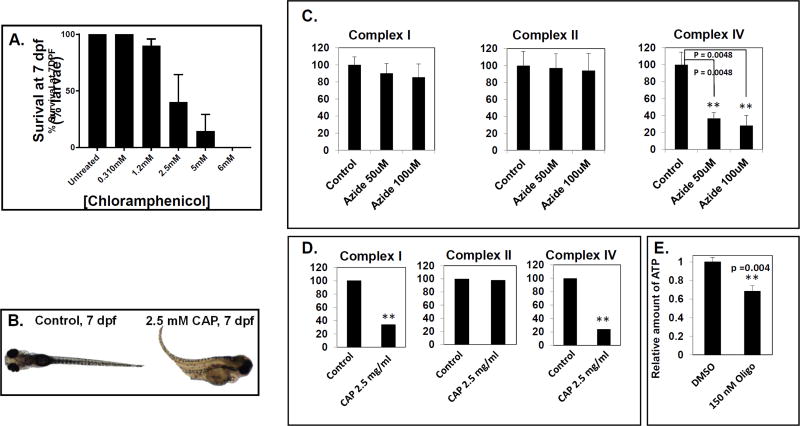
Fig. 5. Chloramphenicol inhibition of mitochondrial translation, and quantitation of biochemical effects in zebrafish larvae.
(A) Survival of zebrafish larvae treated from 2 dpf through 7 dpf with varying concentrations of chloramphenicol are shown. Black bars represent mean survival and error bars represent standard error of the mean (±SEM). n ≥ 10 larvae per condition. A minimum of 3 biological replicates were performed per condition, except for 5 mM chloramphenicol in which only 2 biological replicates were performed. (B) Representative images are shown of 7 dpf age-matched, untreated control larvae (left panel) and larvae exposed to 2.5 mM chloramphenicol from 2 dpf (right panel). (C–D) Biochemical effects of RC inhibitors on ETC enzyme activities and ATP content in zebrafish larvae. (C) Mitochondrial complex I, complex II, and complex IV activities in zebrafish treated with 50 or 100 µM sodium azide from 5 dpf for 8 hours. (D) Mitochondrial complex I, complex II, and complex IV ETC enzyme activities in zebrafish treated with 2.5 mg/mL chloramphenicol from 2 dpf through 7 dpf. (E) ATP content in zebrafish treated with 150 nM oligomycin from 5 dpf for 24 hours. For panels (C–E), black bars represent mean ETC activity levels (% control) or relative ATP levels and error bars represent standard error. A minimum of 3 biological replicates each with 3 technical replicates were performed per condition (except for (D) where n=1 with 3 technical replicates performed). N = 30–50 total larvae per condition. Control ETC enzyme activity spectrophotometry assay values were: complex I (µmoles of DCPIP reduction/min/mg protein), 0.384 (C) and 0.366 (D); complex II (µmoles of DCPIP reduction/min/mg protein), 0.206 (C) and 0.197 (D); complex IV (µmoles of cytochrome c oxidized/min/mg protein), 15.3 (C) and 11.2 (D). **p < 0.01, student’s T-test.

