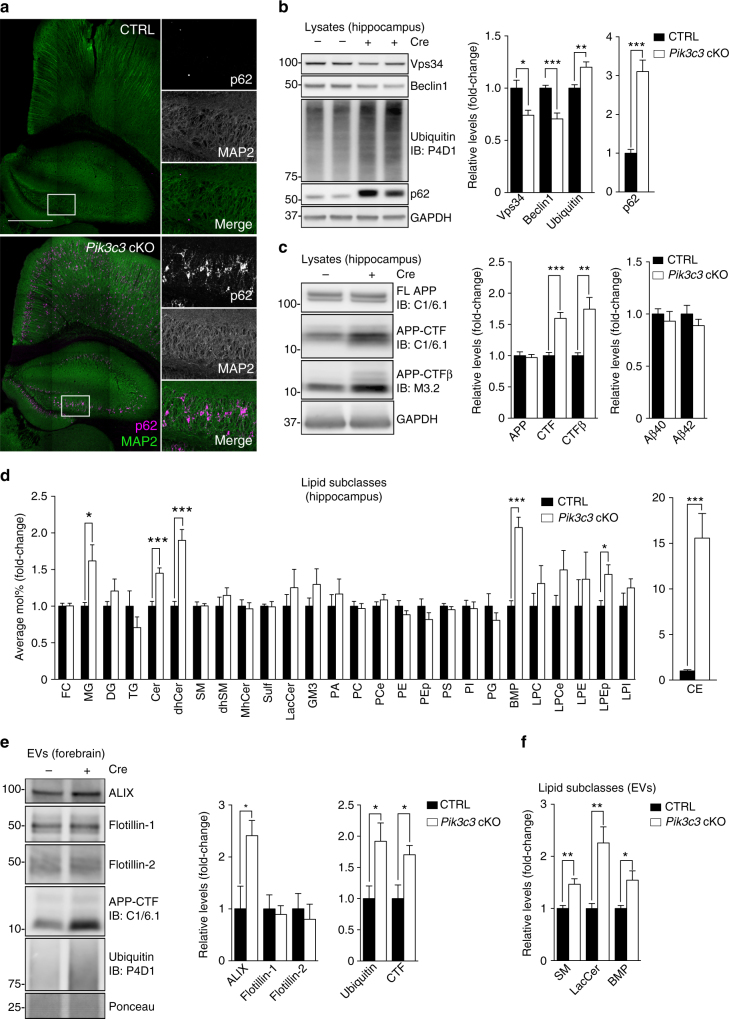
Fig. 7.
Neuronal Vps34 deficiency in vivo leads to endolysosomal dysfunction and increased exosomal APP-CTF sorting. a Brain sections from 2-month-old Pik3c3flox/flox (CTRL) and Pik3c3flox/flox; CaMKII-Cre (Pik3c3 cKO) mice immunostained for MAP2 and p62. Scale bar, 500 µm. b, c Western blot analysis of hippocampus lysates from 2-month-old CTRL and Pik3c3 cKO mice (mean ± SEM, N = 7 and 8, respectively in b; N = 8 in c, from two independent experiments). c Right panel, soluble Aβ40 and Aβ42 levels in hippocampus lysates of 2-month-old CTRL and Pik3c3 cKO mice (mean ± SEM, N = 9 mice, from two independent experiments). *p < 0.05, **p < 0.01, ***p < 0.001 in two-tailed Student’s t test. d LC–MS analysis of lipids extracted from hippocampus lysates of 2-month-old CTRL and Pik3c3 cKO mice. Values are expressed as average Mol% of total lipids measured, normalized to CTRL. (mean ± SEM, N = 8 and 9, respectively, from two independent experiments). *p < 0.05, ***p < 0.001 in two-tailed Student’s t test. e Western blot analysis of EVs isolated from the forebrain of 2-month-old CTRL and Pik3c3 cKO mice. Bar graph denotes average protein levels normalized to CTRL (mean ± SEM, N = 4 mice, from two independent experiments). *p < 0.05 in two-tailed Student’s t test. f LC–MS analysis of EVs from 2-month-old CTRL and Pik3c3 cKO mice. Values are express ed as average Mol% of total lipids measured, normalized to CTRL. For complete lipid panel and BMP species analysis, see Supplementary Fig. 8e. (mean ± SEM, N = 6 mice, from two independent experiments). *p < 0.05, **p < 0.01 in two-tailed Student’s t test

