Fig. 3.
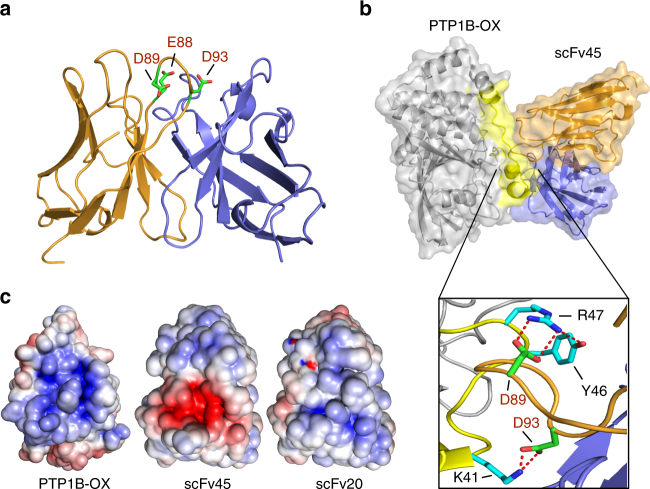
Crystal structure of scFv45 and molecular explanation for scFv45 specificity for PTP1B-OX. a Crystal structure of scFv45 highlighting acidic residues Asp89, Glu88, and Asp93 in the complementarity-determining region (CDR). For representative numbering of scFv45 residues, the first amino acid denotes the residue directly following the OmpA cleavage site. b Molecular modeling of the PTP1B-OX:scFv45 complex, with PTP1B-OX shown in gray, and the regional boundaries of the scFv45-binding interface determined by our structural proteomic approach shown in yellow. The inset shows H-bonding between residues of PTP1B-OX (K41, Y46, and R47) and the acidic residues in the CDR of scFv45. c Surface electrostatic potential of PTP1B-OX (left), scFv45 (middle), and scFv20 (right)

