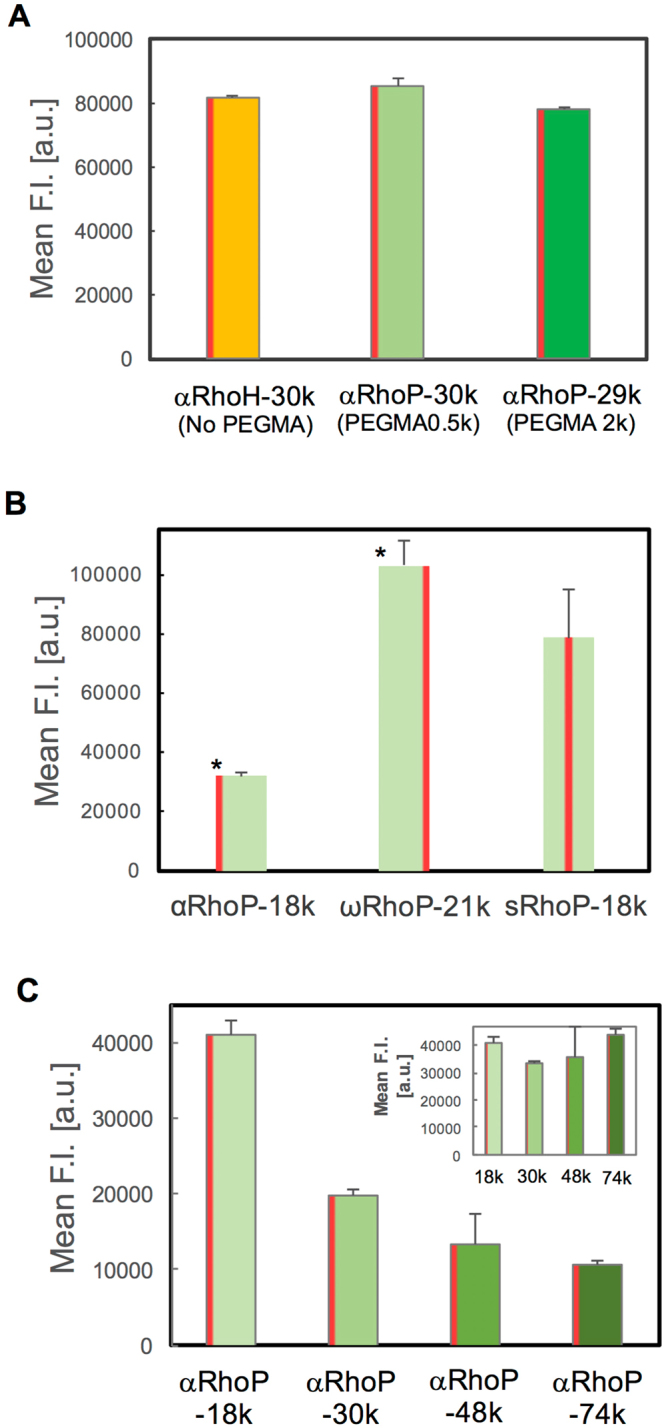
Figure 4.

Fluorescence intensity of RhoP-treated HeLa cells. Each polymer was added to HeLa cells and incubated for 1 h. The fluorescent intensity was evaluated by flow cytometry and analyzed for 5,000 cells. For the analysis, the fluorescence intensity values were normalized based on the Rho substitution degree of each polymer. [RhoP] = 1.0 mg/mL (A) Effect of the PEG chain length. The substitution degree of PEGMA was approximately the same in all polymers; the molecular weight of PEGMA was 2,000 g/mol (left) and 500 g/mol (right). (B) Effect of the position of Rho. The statistical significance of the difference is indicated by * (p < 0.01) vs sRhoP. (C) Effect of molecular weight of αRhoPs. (inset) Data plotted as a function of the polymer molar concentration.
