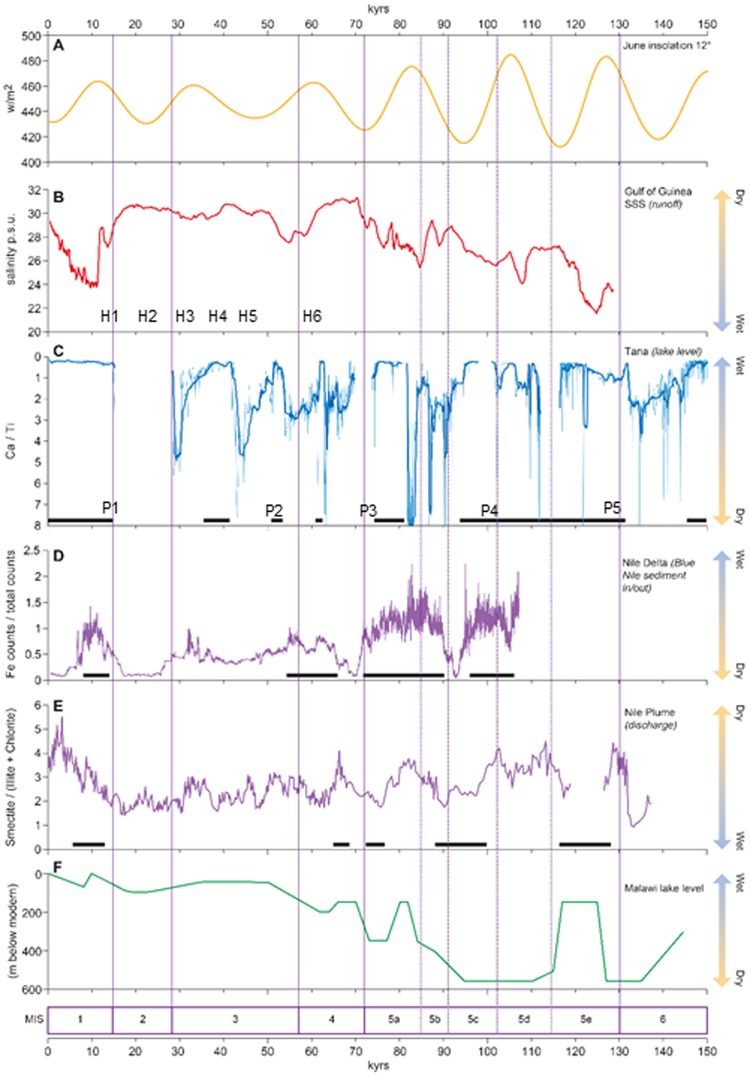
Figure 4.
Regional expression of the climate changes at Lake Tana. (A) June insolation at 12° N. (B) Sea-surface salinity in the Gulf of Guinea, core MD03-270728. (C) Ca/ Ti ratios, Lake Tana. (D) Fe XRF counts in core MS27PT, Nile delta margin29. (E) Smectite/(chlorite + illite) ratios in core Geo Tü SL110, Nile plume, eastern Mediterranean30. (F) Lake Malawi18. Solid bars indicate high lake levels (C), and high Nile discharge (D,E). Approximate positions of Heinrich events (H1–H6) and P-reflectors (P1–P5) shown. Figure generated in Adobe Illustrator CS6 Version:16.0.4. https://www.adobe.com/uk/.

