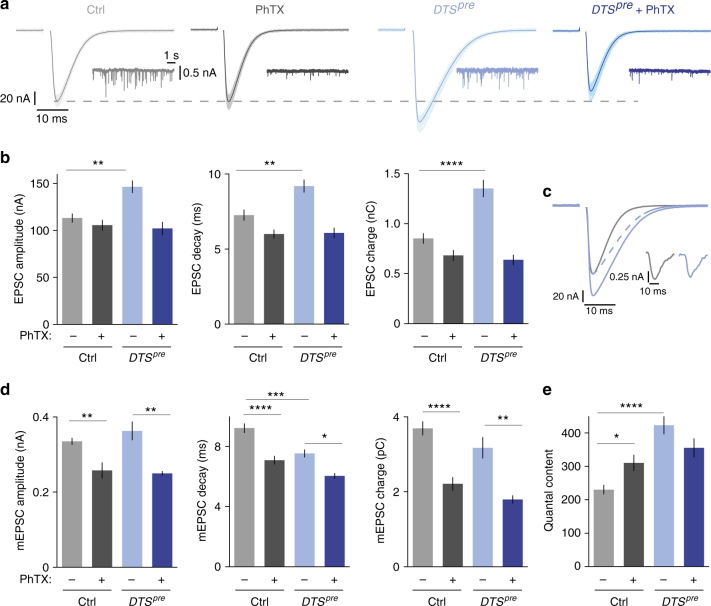
Fig. 4.
Presynaptic proteasome perturbation increases EPSC amplitude and decay time. a Two-electrode voltage-clamp recordings of DTSpre mutants and controls with or without PhTX application (20–30 µM; 1 mM [Ca2+]e). Representative EPSCs (50 sweeps per cell; the average is displayed in darker color; stimulation artifacts have been blanked for clarity) and mEPSCs are shown. b Quantification of the experiment shown in (a). Note that presynaptic proteasome inhibition leads to an increase in EPSC amplitude, decay time constant and charge. Moreover, proteasome inhibition blocks homeostatic plasticity in response to PhTX application. Mean ± s.e.m.; n ≥ 10 cells; **p < 0.001; ****p < 0.00001; ANOVA and Tukey’s multiple comparison tests. c Overlay of an average EPSC of a control cell (gray) and after proteasome inhibition (blue; DTSpre). The dashed line shows the EPSC for DTSpre normalized to the EPSC amplitude of control. Inset: representative mEPSCs for control and DTSpre. d Quantification of mEPSC amplitude, decay and charge. Due to technical reasons, mEPSCs were recorded in different cells than EPSCs. Note that the EPSC decay is faster than the mEPSC decay, likely due to partial glutamate receptor desensitization/saturation. Mean ± s.e.m.; n ≥ 6 cells; *p < 0.05, **p < 0.001; ***p < 0.0001; ****p < 0.00001; ANOVA and Tukey’s multiple comparison tests. e Quantal content was calculated by the ratio of EPSC charge/mEPSC charge. Mean ± s.e.m.; n ≥ 6 cells; *p < 0.05; ****p < 0.00001; ANOVA and Tukey’s multiple comparison tests

