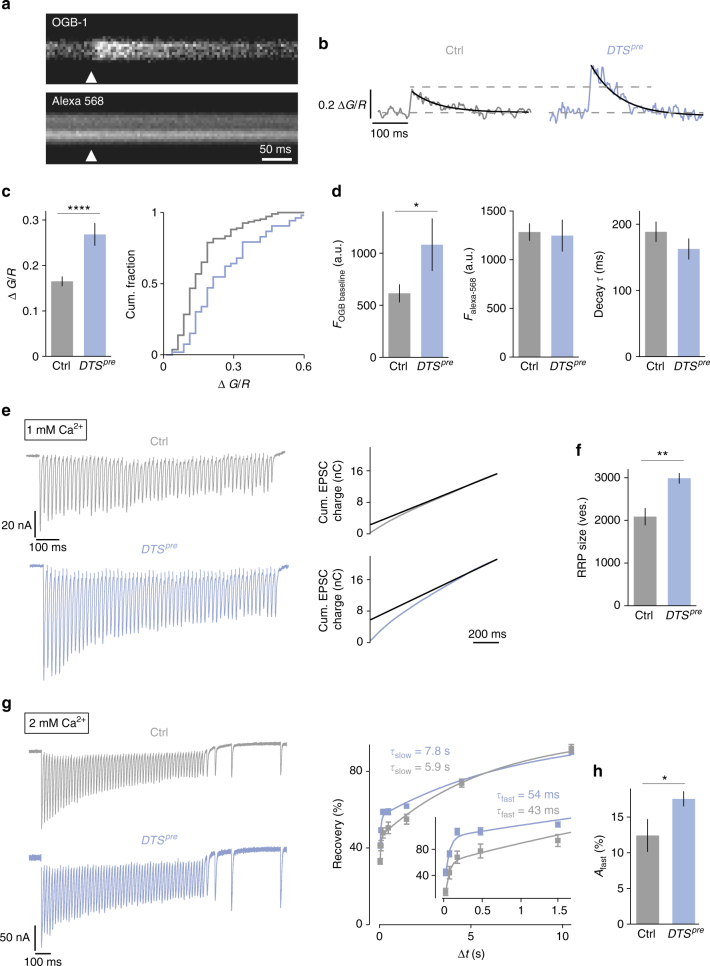
Fig. 6.
Proteasome perturbation increases presynaptic Ca2+ influx, RRP size and the amplitude of the fast recovery phase. a Representative two-photon line scans of a control bouton after loading with OGB-1 and Alexa-568. Arrowhead indicates AP-stimulus onset. b Representative spatially averaged Ca2+ transients of a control synapse and a DTSpre synapse (average of 10 sweeps). c Quantification of Ca2+-transient peak amplitudes of control and DTSpre synapses and cumulative frequency plot. Proteasome inhibition results in a significant increase in the peak amplitude compared to control cells. d Baseline fluorescence of the Ca2+ indicator OGB-1 and the Ca2+-independent dye Alexa-568 in the two genotypes. Baseline OGB-1 fluorescence is significantly higher in DTSpre synapses. The decay time constant τ is not changed. Mean ± s.e.m.; n ≥ 53 boutons; *p < 0.05; ****p < 0.00001; Wilcoxon rank-sum test. e Left: Representative EPSC trains in response to 60-Hz stimulation (60 stimuli, 1 mM [Ca2+]e) for control cells and DTSpre mutant cells. Right: cumulative EPSC charge was calculated by back-extrapolation of a linear fit (black line) to the last 15 stimuli of the cumulative EPSC integrals to time point zero. f RRP size was calculated by dividing cumulative EPSC charge by the average mEPSC charge. g Left: Example of EPSCs during 60-Hz stimulation (60 stimuli, 2 mM [Ca2+]e) followed by recovery pulses given at intervals of 25, 75, 175 and 475 ms after the last train stimulus of the indicated genotypes. Right: Average recovery (mean EPSC amplitude at a given interval divided by the first EPSC amplitude of the 60 Hz train) versus recovery interval (Δt) of the indicated genotypes superimposed with biexponential fits. Inset shows the data at short intervals. Biexponential fits of average data gave the time constants noted in the figure. h Average amplitude of the fast recovery component ‘Afast’ of the two groups obtained from bi-exponential fits of individual synapses. Note the significant increase in the fast recovery component in DTSpre mutants (there was no difference in Aslow and recovery kinetics between the two groups). Mean ± s.e.m.; n ≥ 10 cells; *p < 0.05; **p < 0.001; Student’s t-test

