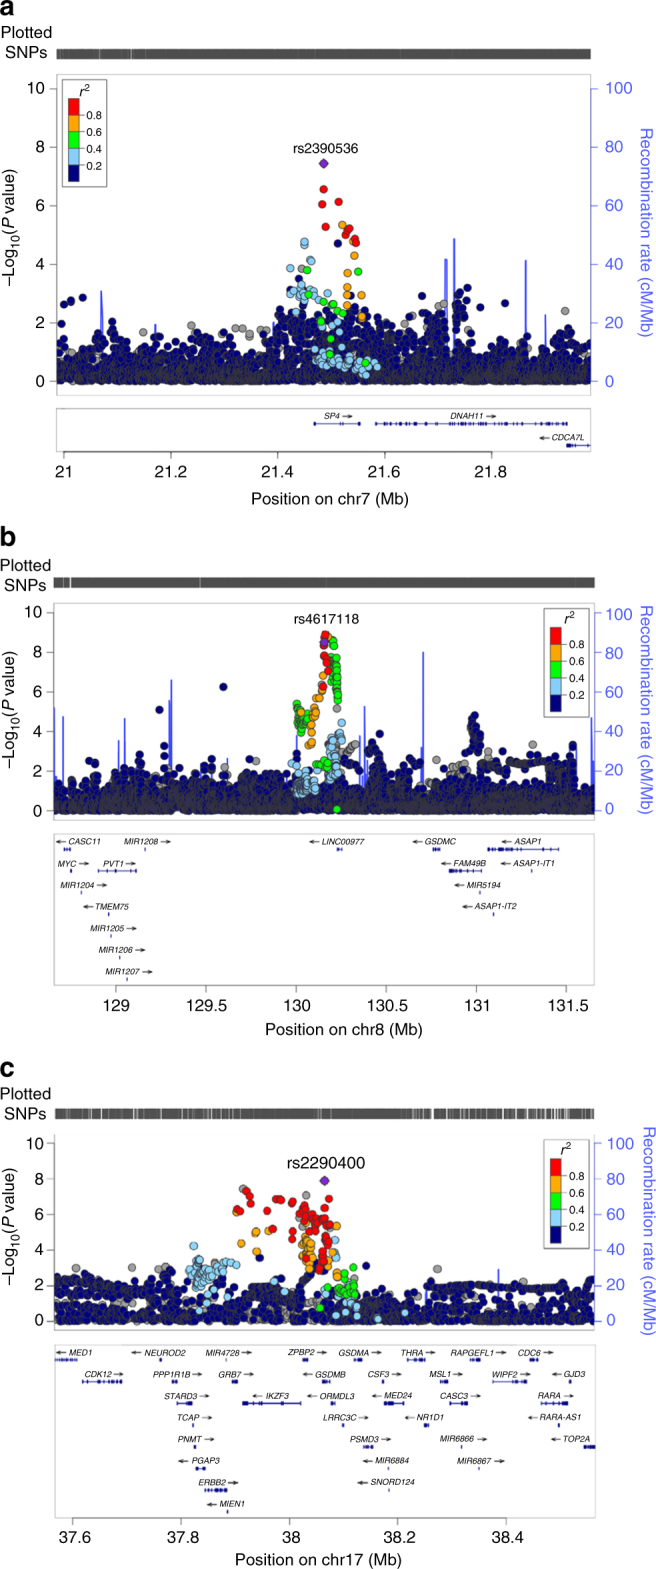
Fig. 2.

Genetic association peaks at chromosomes a 7, b 8, and c 17. Genotypes include both “on array” SNPs and additional SNPs imputed as described in the Methods. The top associated “on array” SNP from the CCRLP/Kaiser discovery analysis is indicated by its “rs” identity (and purple diamond shape), and other SNPs are displayed by color showing their extent of genetic linkage with this top SNP. Recombination rate, genetic position, and the locations of nearby genes are indicated. The P values for the association at chromosome 7p15.3 (rs2390536, near SP4, OR = 1.20, 95% CI: 1.13–1.29, P = 3.6 × 10⁻⁸), chromosome 8q24.21 (rs4617118, OR = 1.27, 95% CI: 1.17–1.38, P = 3.1 × 10⁻⁹), and chromosome 17q12 (rs2290400, OR = 1.18, 95% CI: 1.11–1.25, P = 2.1 × 10⁻⁸)
