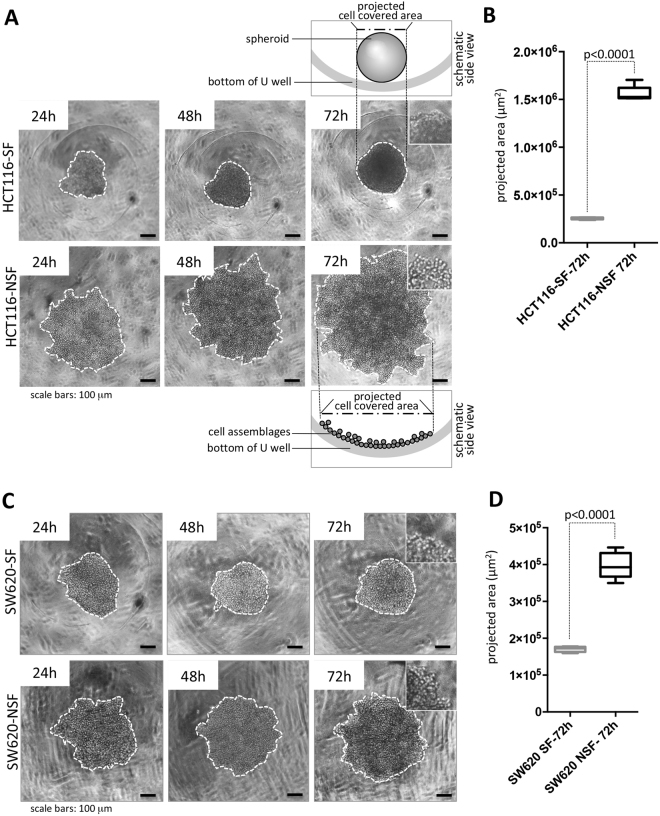
Figure 2.
Comparison of the phenotype of HCT116-SF and SW620-SF cells versus their NSF sublines. (A) Time course of spheroid formation of HCT-116-SF cells compared to HCT-116-NSF. Lack of spheroid formation in the case of HCT116-NSF is evident from the formation of loosely associated cells at the base of the round well bottom. For clarity boarders of cell covered areas (either spheroid projected areas or loose cell assemblages, see schematic side view) are indicated by white dotted lines. (B) Quantification of projected spheroid versus cell assemblage areas of after 72 hours, n = 7 for SF and NSF each. (C) Time course of spheroid formation of SW620-SF cells compared to HCT116-NSF. Lack of spheroid formation in the case of SW620-NSF is evident from the formation of loosely associated cells at he base of the round well bottom. For clarity boarders of cell covered areas (either spheroids or loose cell assemblages) are indicated by white dotted lines. (D) Quantification of projected spheroid versus cell assemblage areas of after 72 h, n = 5 each. Boxes represent the interquartile range; the horizontal line in the box indicates the median; whiskers extend to min and max; p-values are indicated. Scale bars: 100 µm.

