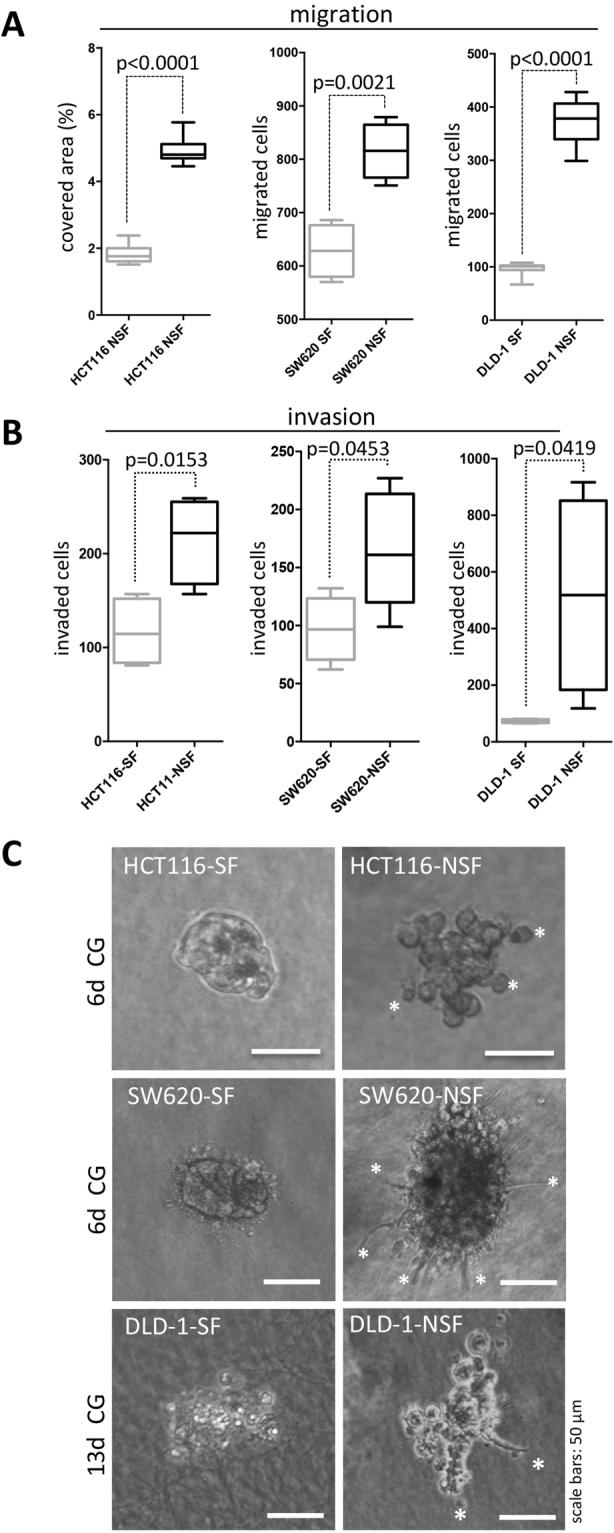
Figure 4.

Increased migration and invasion of NSF sublines. (A) For assessment of migration a transwell migration assay was performed and the number of migrated cells was determined after 20 h. In case of HCT116 and DLD-1 cells eight transwell inserts were evaluated; for SW620 cells n = 4. (B) A transwell invasion assay was used and cells invaded through collagen I covered membranes were counted after 24 hours; n = 4 for each individual experiment. Boxes represent the interquartile range; the horizontal line in the box indicates the median; whiskers extend to min and max. P values are indicated. (C) Representative phase contrast pictures of colonies grown from single cells seeded into collagen I gels (CG). Pictures were taken after 6 days (HCT116 and SW620 lines) and 13 days (DLD-1 lines). White asterisks indicate single cells or invasive structures protruding into the matrix. Scale bars: 50 µm.
