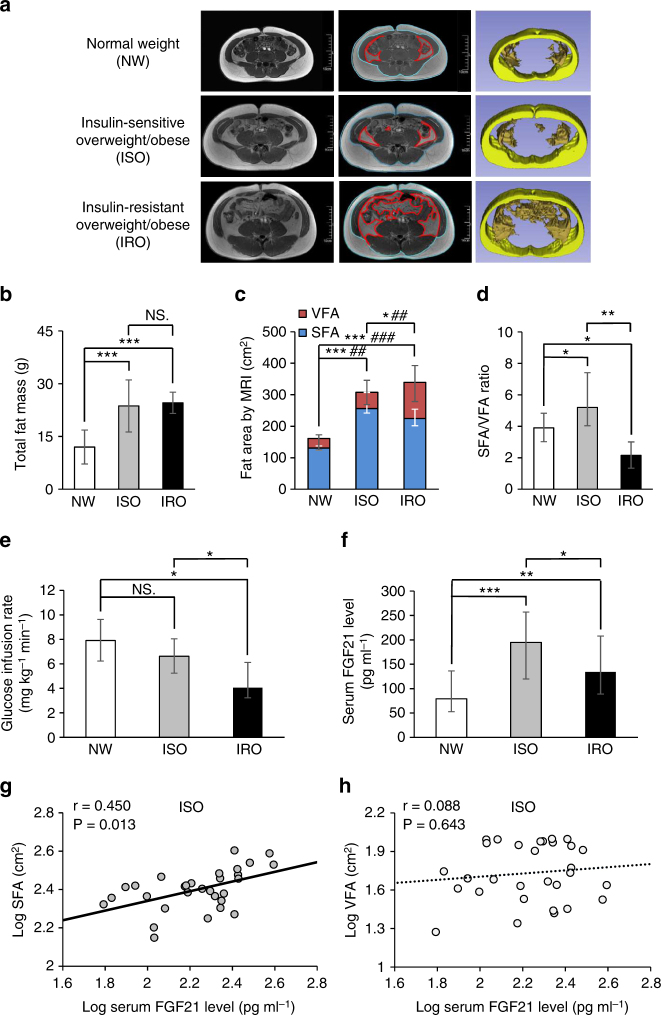
Fig. 1.
Positive association between FGF21 and SFA in ISO individuals. a Representative abdominal MRI of three groups of individuals, including NW (n = 30), ISO (n = 30) and IRO (n = 30). Raw (left panel) and marked MRI (middle panel) at navel level, blue lines delineate SFA and red lines delineate VFA, 3D-reconstructed MRI (right panel) after eliminating other organs, yellow represents subcutaneous fat area (SFA) and orange represents visceral fat area (VFA). Scale bar = 10 cm. b Total fat mass in three groups. c Fat distribution (SFA and VFA contents) evaluated by MRI in three groups. *comparison of SFA, #comparison of VFA. d SFA and VFA ratio in three groups. e Comparison of glucose infusion rate evaluated by hyperinsulinemic–euglycemic clamp in three groups. f Serum FGF21 levels measured by ELISA in three groups. g,h Relationship between serum FGF21 levels and g SFA as well as h VFA in individuals with ISO. Data are presented as mean ± s.d. or median (interquartile range). Significance was determined by one-way analysis of variance (ANOVA) with Bonferroni multiple-comparison analysis (b–f) and Pearson’s correlations (g, h). * or # P < 0.05, ** or ## P < 0.01, *** or ### P < 0.001, NS. non-significance

