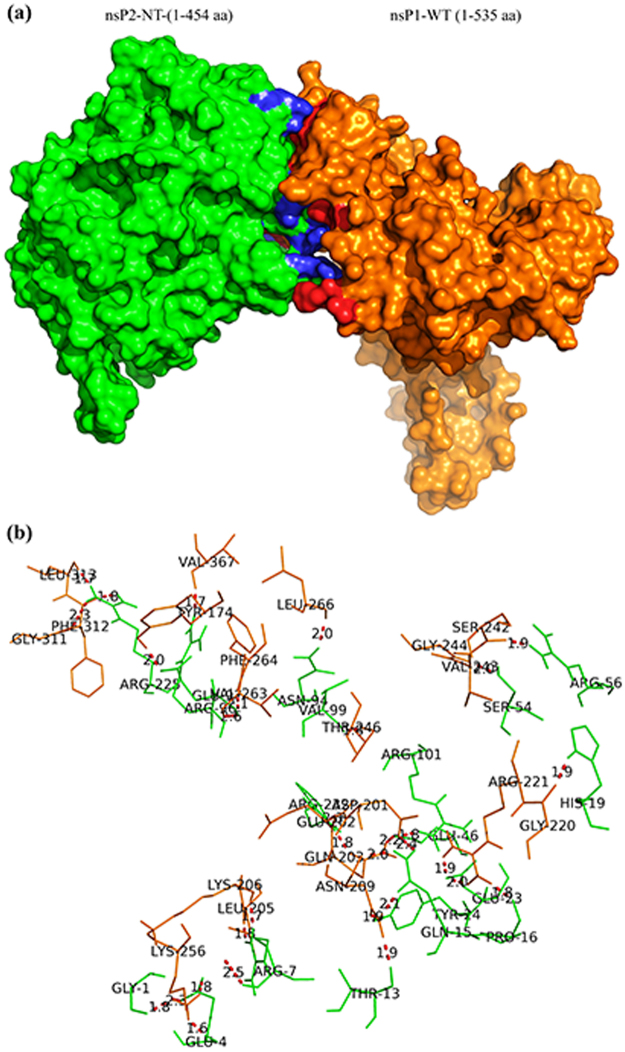
Figure 5.
Protein-protein docking analysis shows the specific amino acids responsible for the nsP1-nsP2 interaction. The protein-protein docking between nsP1-WT and nsP2-NT was performed using the ClusPro 2.0 web server. (a) The most stable conformation of the complex of nsP2-NT (green) and nsP1-WT (orange). Polar interacting residues within 2.6 Å distance of nsP1-WT (blue) and nsP2-NT (red) are marked in the complex. (b) The red bridges showing the polar interactions between residues of nsP1-WT (Orange) and nsP2-NT (Green).

