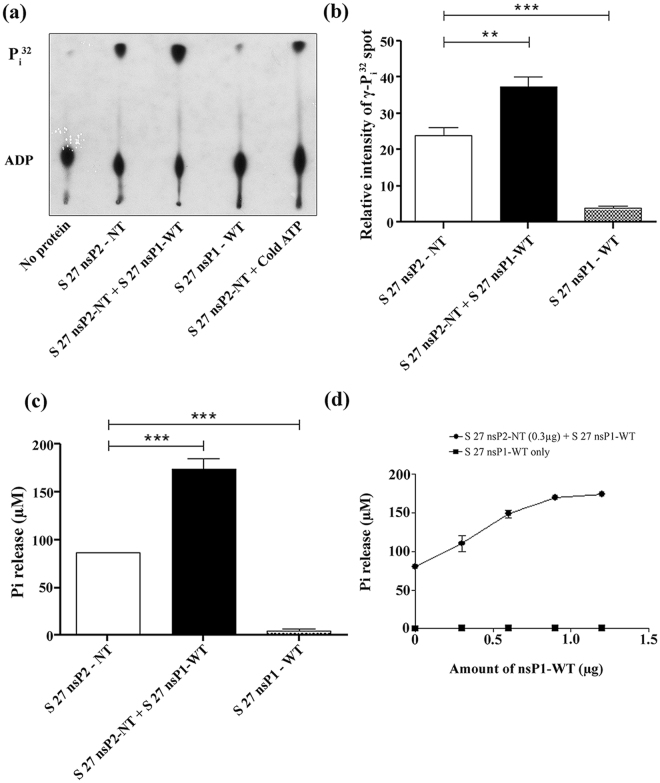
Figure 6.
CHIKV nsP1 modulates the ATPase activity of nsP2-NT in vitro. (a) The ATPase activity was assessed for CHIKV S 27 nsP2-NT and nsP1-WT. The TLC plate was exposed to the X-Ray film and the image was developed. The unlabelled ATP (cold ATP) was used as competitor. (b) Bar diagram showing the relative intensities of free γ-P32 spots that were released by S 27 nsP1-WT/nsP2-NT alone or together. (c) The bar diagram represents the ATPase activities of nsP1-WT or nsP2-NT alone or together which were measured by colorimetric assay. (d) The line diagram showing the ATPase activities of nsP1-WT or nsP2-NT with increasing concentrations of nsP1-WT as measured by colorimetric assay. The data represent mean ± SEM of at least three independent experiments. The p-value ≤ 0.05 was considered as statistically significant difference between the groups. (*P ≤ 0.05).

