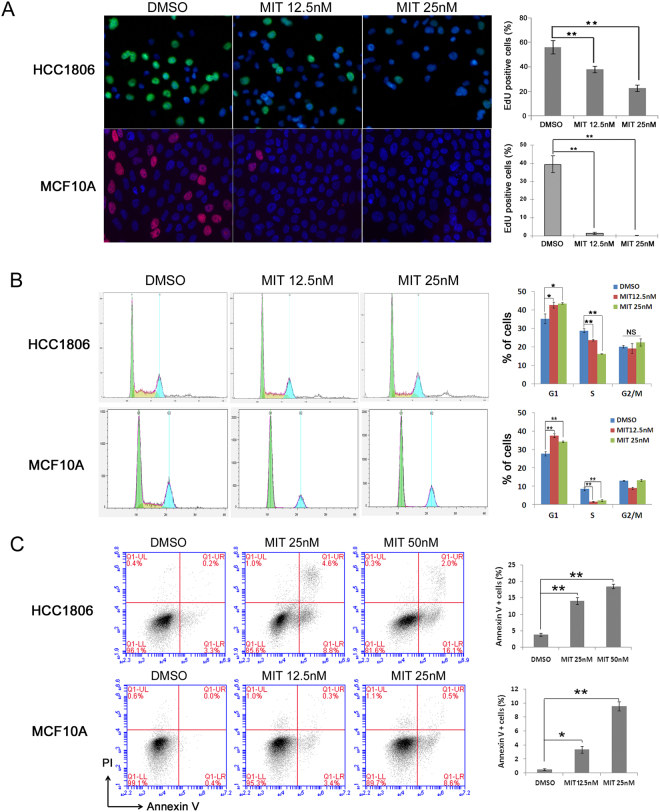
Figure 2.
MIT inhibits DNA synthesis, G1/S cell cycle progression, and survival (A). MIT suppressed HCC1806 and MCF10A cell proliferation in a dosage-dependent manner. MIT significantly inhibited DNA synthesis, as examined using the Click-iTTM EdU Alexa Fluor® 488/647 Imaging Kit. The quantitative results are shown on the right. (B) MIT inhibited G1/S cell cycle progression in a dosage-dependent manner. HCC1806 and MCF10A cells were plated and treated with MIT or DMSO for 24 hours. The cells were then collected and fixed for cell cycle analysis. (C) MIT induced HCC1806 and MCF10A cell apoptosis in a dosage-dependent manner. HCC1806 and MCF10A cells were plated and treated with MIT or DMSO at indicated concentrations for 48 and 24 hours, respectively. The cells were then collected for Annexin V staining and flow cytometry analysis. *P < 0.05, **P < 0.01, t-test.

