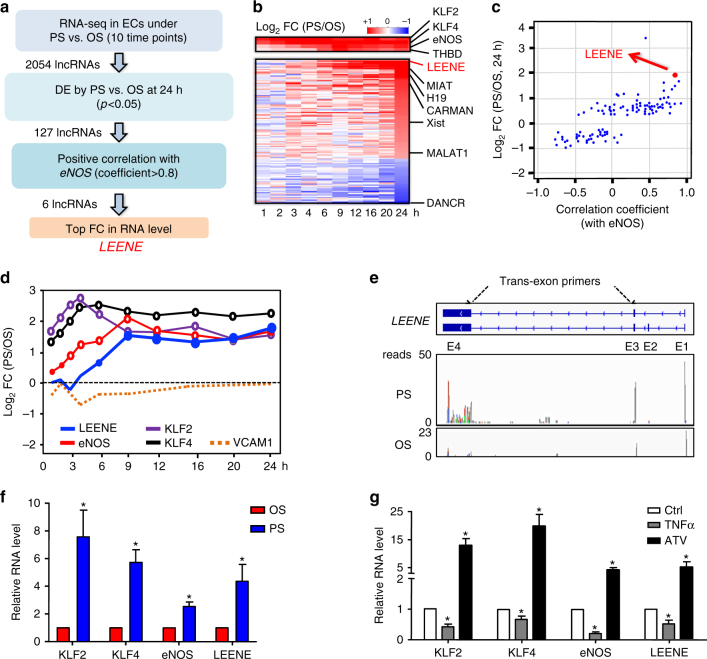
Fig. 1.
Co-regulation of LEENE and eNOS. a LEENE discovery pipeline. b Heatmap of RNA levels of flow-regulated lncRNAs derived from RNA-seq. c Scatter plot of the flow-regulated lncRNAs ranked by differential expression (DE) fold change (FC) at 24 h (PS/OS) and correlation with eNOS mRNA level. d Time course of log2FC of mRNAs encoding various genes. e Structure of LEENE gene encoding two RNA transcripts. Trans-exon primers used in qPCR were designed to amplify fragments flanking Exons 3 and 4. RNA-seq tracks depicting abundance of LEENE in ECs under PS or OS for 24 h. f, g qPCR detection of various RNA transcripts in ECs subjected to PS or OS (in f) or TNFα (100 ng per ml) or atorvastatin (ATV) (1 μM) (in g) for 24 h. Data are presented as mean ± SEM, n = 5 in each group. *p < 0.05 compared to OS (in f, based on Student’s t test) or ctrl (in g, calculated by ANOVA followed by Bonferroni post test)

