Fig. 3.
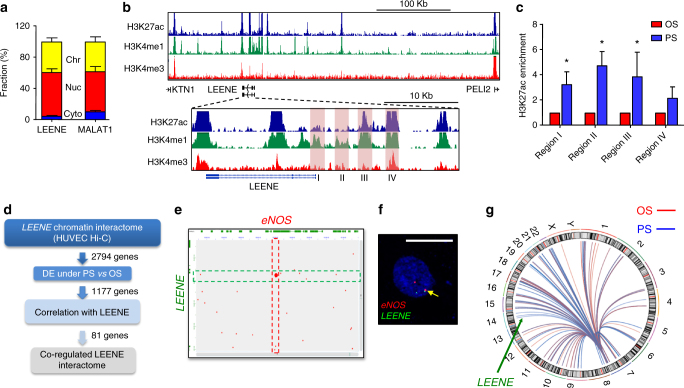
LEENE RNA is nucleus-localized and its DNA lies in enhancer region interacting with eNOS promoter. a qPCR quantitation of LEENE and MALAT1 in subcellular fractions from ECs, plotted as percentages in association with chromatin (Chr), nucleoplasm (Nuc), and cytoplasm (Cyt). b ENCODE HUVEC ChIP-seq signals in 400 kb (top tracks) and 50 kb (bottom tracks) regions surrounding LEENE. Regions in shades were selected for H3K27ac ChIP-qPCR in c. d Flow chart of integrative Hi-C and RNA-seq analyses. e LEENE–eNOS interaction map generated from GEO HUVEC Hi-C analysis. Red pixels represent interactions between two regions, respectively, in chr7 (X-axis) and chr14 (Y-axis). The highlighted regions correspond to eNOS promoter and LEENE enhancer regions. f Representative image of DNA FISH with respective probes recognizing LEENE and eNOS genomic loci. Arrow indicates proximity association between two loci. Scale bar = 10 μm. g 4C-seq mapping of inter-chromosomal interactions between eNOS bait (249 bp) and lncRNAs listed in Fig. 1b. Each line in the circoplot represents an interaction and the color intensity reflects the normalized reads of ligated DNA ends. Chromosomes are numbered around the circle. Data are presented as mean ± SEM, n = 5 in each group. *p < 0.05 compared to OS based on Student’s t test

