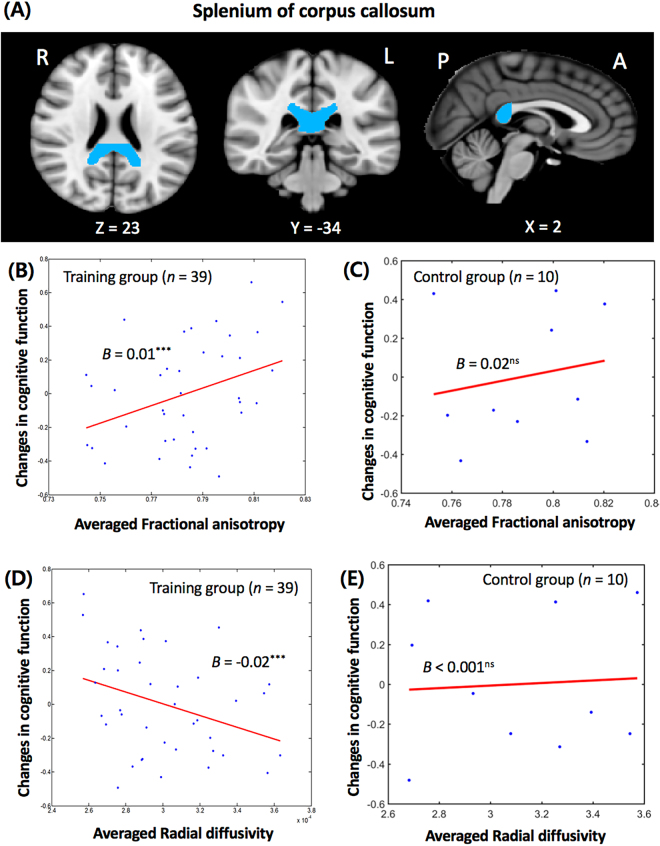
Figure 2.
(A) The location of the splenium of corpus callosum (MNI coordinates: 23, −34, 2). (B) The relationship between the averaged fractional anisotropy and the changes in cognitive function (overall model’s adjusted r2 = 0.34; F = 6.22; p < 0.001; beta = 0.0051; p < 0.001) of the splenium of corpus callosum in the training group. The results were significant at a corrected false discovery rate-corrected p < 0.05 to control for the multiple comparisons. (C) The relationship between the averaged fractional anisotropy and the changes in cognitive function (overall model’s adjusted r2 = 0.06; F = 0.83; p = 0.52; beta = 0.018; p = 0.47) of the splenium of corpus callosum in the control group. (D) The relationship between the averaged radial diffusivity and the changes in cognitive function (overall model’s adjusted r2 = 0.37; F = 7.04; p < 0.001; beta = −0.0193; p < 0.001) of the splenium of corpus callosum in the training group. The results were significant at a corrected false discovery rate-corrected p < 0.05 to control for the multiple comparisons. (E) The relationship between the averaged radial diffusivity and the changes in cognitive function (overall model’s adjusted r2 = 0.01; F = 0.96; p = 0.47; beta < 0.001; p = 0.82) of the splenium of corpus callosum in the control group.

