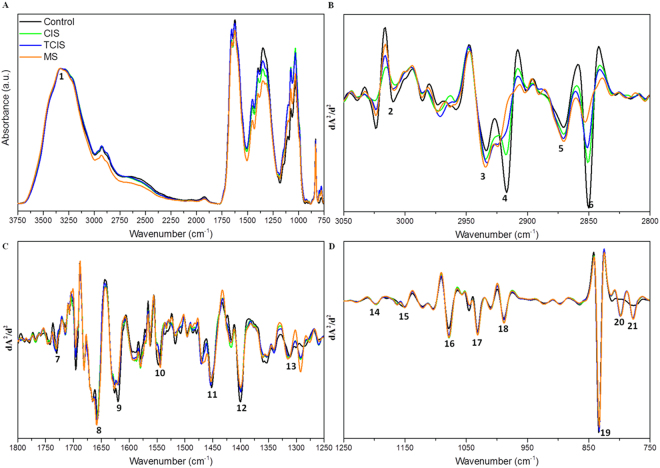
Figure 1.
Representative IR spectra of the control, CIS, TCIS and RRMS patients’ CSF samples: (A) absorbance spectra in the 3750–750 cm−1 region (normalized with respect to the amide A band located at 3330 cm−1), (B) second derivative vector normalized spectra in the C-H region (3050–2800 cm−1), and second derivative vector normalized spectra in the (C) 1800–1250 cm−1, and (D) 1250–750 cm−1 ranges of the fingerprint region (the labeled peaks are assigned in Table S-2).

