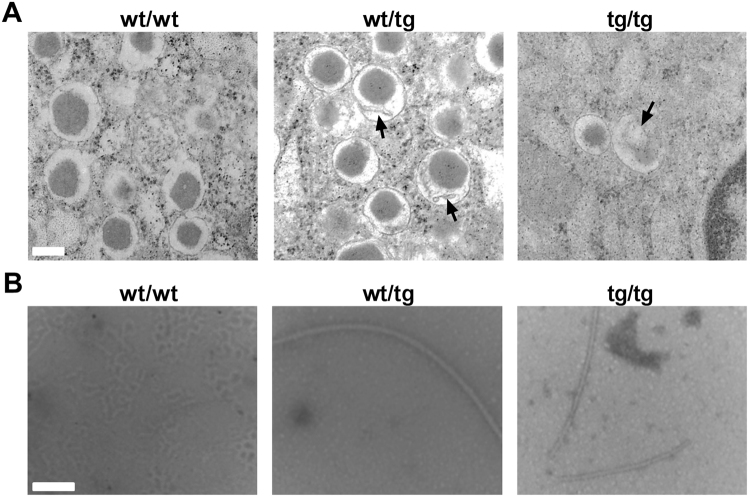
Figure 2.
Pancreatic beta-cell morphology and amyloid fibrils isolated from islets of hIAPP mice. (A) Pancreatic beta-cells of hIAPP mice were studied using transmission electron microscope. White bar depicts 200 nm, whereas black arrows represent insulin vesicles with aggregates. (B) Amyloid fibrils were isolated from pancreatic islets of hIAPP mice and fibrils were visualized using transmission electron microscope (white bar depicts 100 nm). wt/tg and tg/tg denote hemizygous or homozygous transgenic hIAPP mice, respectively. Representative areas are shown, n = 4–6 for A, n = 2–4 for B.

