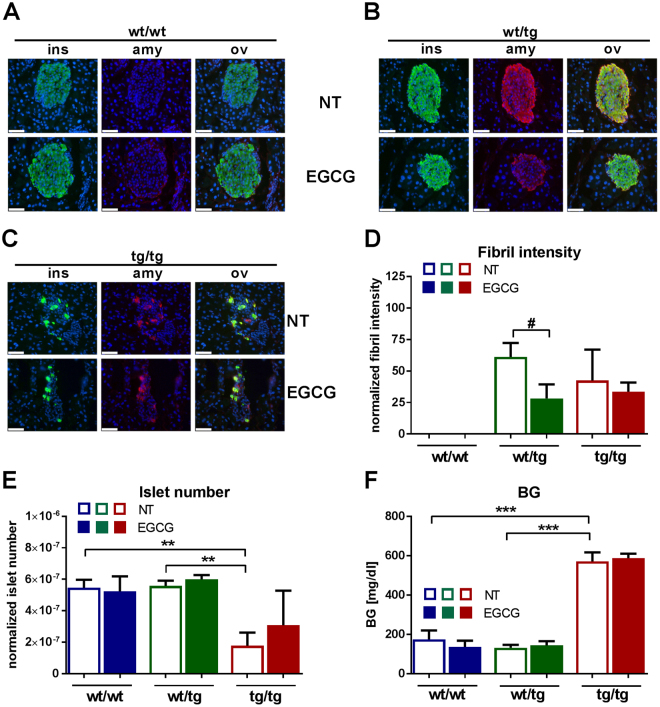
Figure 5.
The effect of EGCG on pancreatic islets of hIAPP mice. (A–C) Pancreata were stained with anti-insulin (green) and anti-amyloid fibril (91D7E8, red) antibodies and visualized by fluorescence microscopy. Cell nuclei were stained with DAPI (blue), white bars represent 50 µm. ins:insulin, amy:amyloid fibril, ov: overlay, NT:non-treated control group, EGCG:EGCG-treated group. Representative areas are shown. (D) The intensity of amyloid fibril staining was calculated using Architect software. (E) Pancreatic islet numbers were manually counted and numbers were normalized to total pancreas area. (F) Random-fed blood glucose levels. wt/tg and tg/tg denote hemizygous or homozygous transgenic hIAPP mice, respectively. Columns represent averages ± standard deviations; n = 4–7. #Denotes significant differences between wt/tg untreated and wt/tg EGCG-treated mice; #p < 0.05; *Denotes significant differences between wt/wt and tg/tg or wt/tg and tg/tg mice, respectively; **p < 0.01, ***p < 0.001.

