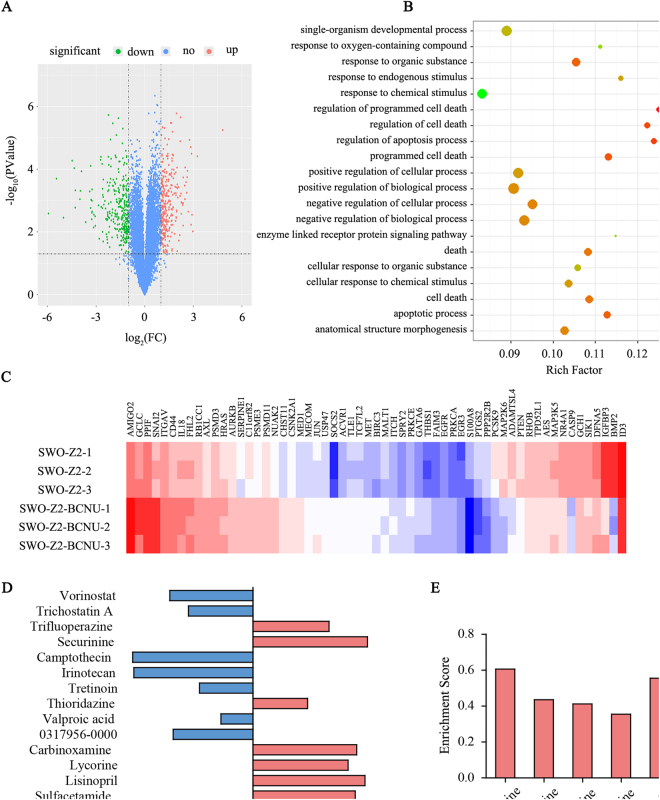
Figure 1.
Data mining of gene expression profiles and drug screening in the Connectivity Map database. (A) Significance analysis of microarray (SAM) was performed to identify differentially expressed genes between SWOZ2 and SWOZ2-BCNU cells. (B) GO analysis of a cluster of differentially expressed genes between SWOZ2 and SWOZ2-BCNU cells was performed with GenCLiP software. (C) Supervised hierarchical clustering results showing 59 apoptosis-related differentially expressed genes between SWOZ2 and SWOZ2-BCNU. Samples were denoted in columns, and genes were denoted in rows. The mapped expression levels for all genes were depicted using a colour scale; highly expressed genes were indicated in red and poorly expressed genes in blue. (D) Gene expression signatures connect small molecules in the connectivity map database. Small molecules were picked after uploading the probe list of differentially expressed genes between SWOZ2 and SWOZ2-BCNU cells to the Connectivity Map database. The 15 highest-ranking small molecules correlated with SWOZ2 and SWOZ2-BCNU cell differentially expressed genes were listed on the left. Positive correlations were indicated in red and negative correlations in blue. (E) Enrichment scores of all phenothiazines among the 15 highest-ranking small molecules.

