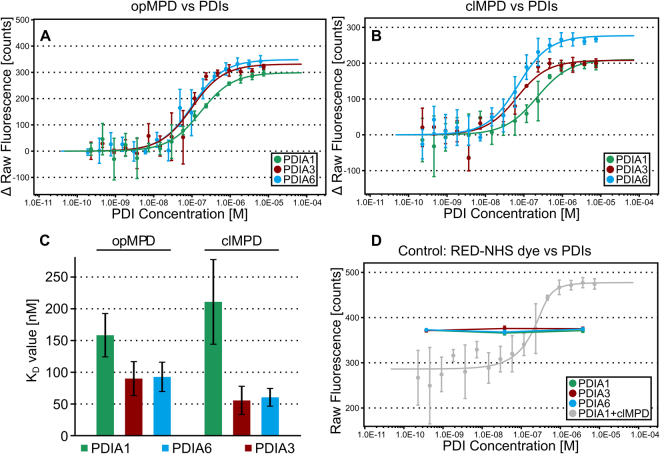
Figure 3.
MST analysis of PDIs and MPD. (A and B) Dose-response curves of MST analysis (initial fluorescence, n = 3) of PDIA1, PDIA3 and PDIA6 with opMPD (A) or clMPD (B) as indicated in the caption. (C) Summary of the KD values shown as column chart (error bars indicate respective 68% confidence intervals). The evident differences of the KD values are not significant (95% confidence intervals overlap, not shown for clarity). (D) The dose-response curves of the initial fluorescence intensity of the control experiment to test for unspecific binding of PDIA1, PDIA3 and PDIA6 to the RED-NHS dye (3 concentrations, each n = 3, curve of PDIA1 against clMPD for reference in grey) show no PDI-concentration-dependent shift of the initial fluorescence.

