Figure 4.
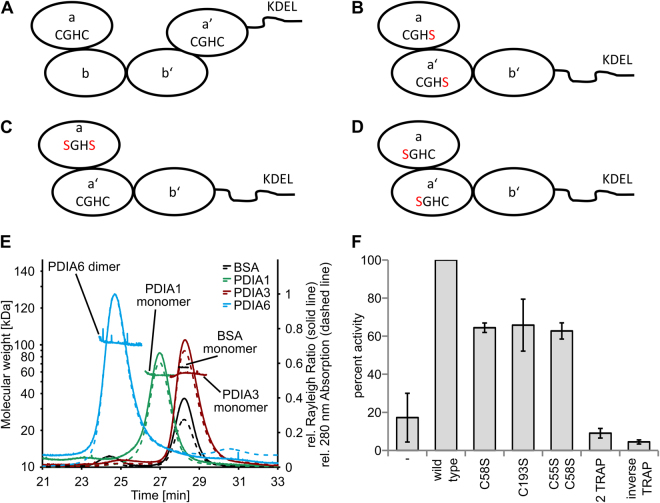
(A) Schematic drawing of the domain arrangement of PDIA1 and PDIA3 in which the CGHC-motive of the catalytically active sites are indicated. (B) Schematic domain arrangement of the 2 TRAP mutant of PDIA6, where both C-terminal cysteine residues of the CGHC-motive are exchanged to serine residues. (C) Schematic drawing of the C55SC58S mutant and (D) the inverse TRAP mutant bearing exchanges in the N-terminal cysteine residues of the CGHC-motive. (E) Chromatograms of the SEC-MALS analysis of PDIA1, PDIA3, PDIA6 and BSA as control. Shown is only the relevant section of the complete elution profile (60 minutes at 0.5 ml/minutes) of the detected absorption at 280 nm (dashed line) and the Rayleigh ratio (solid line, derived from MALS) normalized to PDIA6. In addition, the calculated molecular weight for each slice of the analyzed peaks is shown. (F) Comparison of the activities of indicated TRAP mutants relative to wild-type PDIA6 whose activity was set to 100%.

