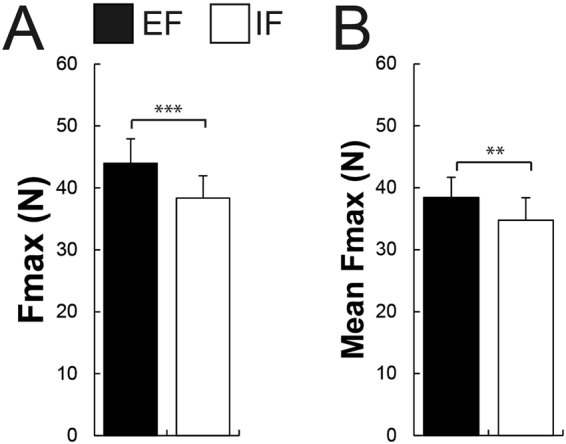
Figure 2.

Shown are mean values and SEM (n = 14) of (A) the force during maximal voluntary contraction (MVC, the best trial) and (B) the force during the 5 MVC trials averaged under both attentional focus conditions (EF vs IF). Participants could generate more force and more force when the 5 MVC trials were averaged with an EF compared to an IF. Black bars represent the external (EF) and the whites ones the internal focus of attention (IF). **P ≤ 0.01, ***P ≤ 0.001.
