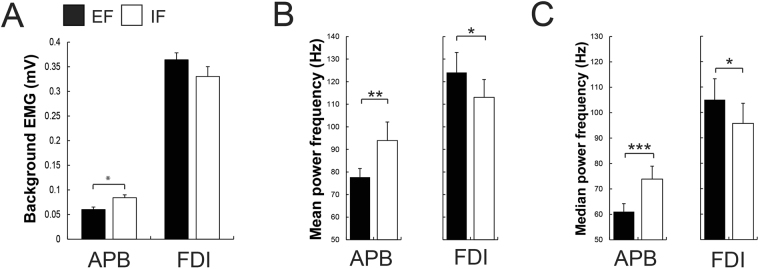
Figure 3.
In all bar graphs, shown are mean values and SEM (n = 14). (A) Participants showed less background EMG during the MVC in the adjacent APB muscle when focusing externally (EF) compared to focusing internally (IF) while no significant difference was found in the prime mover FDI muscle. (B) Shown are the mean power frequency (MNF) and (C) median power frequency (MDF) of adjacent APB and prime mover FDI muscles during the MVC under both focus of attention conditions. Participants showed a smaller MNF and MDF in the APB muscle and a greater MNF and MDF in the prime mover FDI when adopting an EF contrasted to an IF. Black bars represent the external (EF) and the whites ones the internal focus of attention (IF). *P ≤ 0.05, **P ≤ 0.01, ***P ≤ 0.001.

