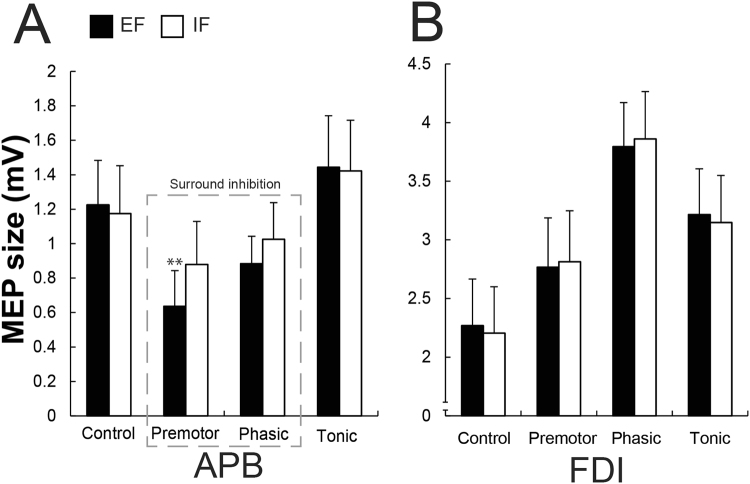
Figure 4.
(A,B) Shown are mean values and SEM (n = 12) of the MEP peak-to-peak amplitude in the two surrounding muscle APB (A) and the prime mover FDI (B) at four different brain stimulation time points (Control, Premotor, Phasic and Tonic) under the two attentional focus conditions (EF and IF). In the surrounding muscle APB, there was a significant interaction effect showing that when adopting a EF contrasted to an IF, surround inhibition was enhanced during the premotor phase. There was a significant main effect of phase in the prime mover FDI (B), reflecting its activation during the motor task. Black bars represent the external (EF) and the whites ones the internal focus of attention (IF). **P ≤ 0.01.

