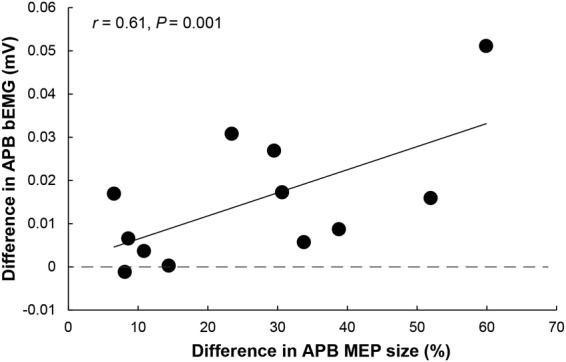
Figure 5.

Shown are the attentional foci-related differences (IF–EF) of APB MEPs size during the premotor phase (related to control as percentage changes) on the abscissa and the differences (IF–EF) in APB bEMG during maximal contraction of the index finger on the ordinate. The robust regression model clearly demonstrates that greater decrease in bEMG found in the adjacent muscle APB during maximal contraction of the prime mover FDI (experiment 1) is accompanied by greater surround inhibition during the premotor phase in the adjacent APB (experiment 2, r = 0.61, P = 0.001).
