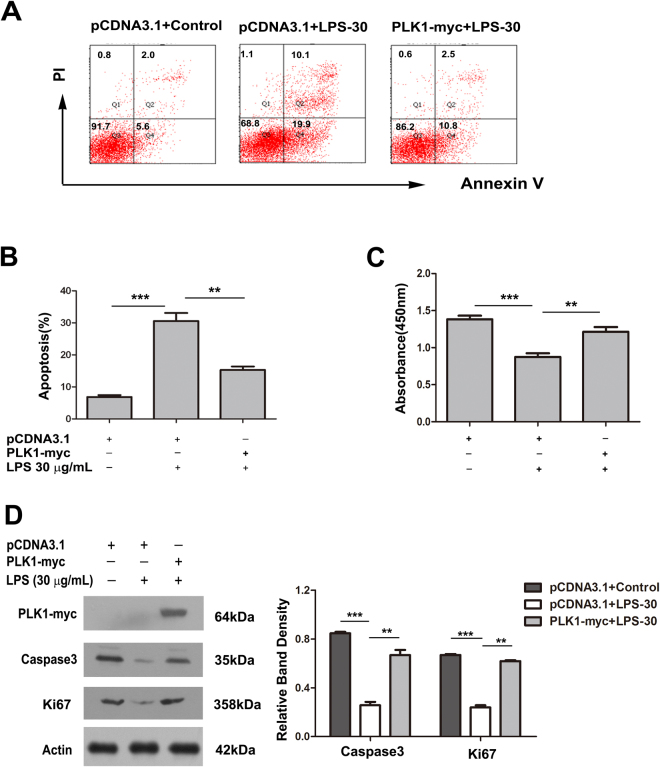
Figure 6.
Over-expression of PLK1 partly rescues the apoptosis and proliferation inhibition caused by LPS in HT29 cells HT29 cells were transfected with pcDNA-PLK1-myc or the control cDNA for 24 h, then exposed to LPS (30 μg/ml) for 24 h. (A) A representative result of apoptosis analysed by Annexin V-FITC/PI double-labelling assay in HT29 cells after the above treatments. (B) Percentages of apoptotic cells in HT29 cells after the above treatments. Values are mean ± SEM (n = 3). **P < 0.01, ***P < 0.001. (C) The absorbance at 450 nm of HT29 cells after the above treatments. Values are mean ± SEM (n = 3). **P < 0.01, ***P < 0.001. (D) The levels of Ki67 and caspase3 after the above treatments. The graph represents the relative band densities. Values are mean ± SEM (n = 3). ***P < 0.001 versus control group. **P < 0.01 versus LPS group.

