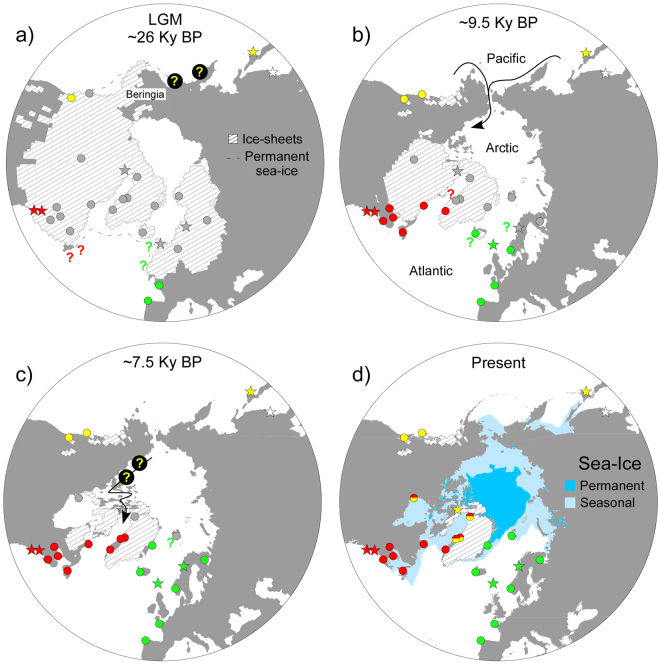
Figure 3.
Glacial vicariance and post-glacial secondary contact of Atlantic phylogroups of S. latissima. The hypothetical glacial ranges and re-distribution of mtCOI phylogroups since the LGM (as inferred from indirect phylogeographic and paleoenvironmental data) are illustrated with a sequence of time points starting with (a) maximum ice-sheet size, (b) the opening of the Bering Strait, (c) the collapse of the Laurentide ice-sheet and the transgression of the Hudson Bay and (d) the present. Phylogroups are coloured as in Fig. 1 (COI-A: yellow, COI-B: light green; COI-C: red, COI-D: white). Sites that were also genotyped for microsatellite markers are marked as circles, otherwise stars. Sites in grey correspond to inhospitable areas (emerged, or under ice-sheets and perennial sea-ice) or beyond ice barriers. Maps were generated with QGIS 2.17 (http://qgis.osgeo.org) using modelled ice-sheet and land extent data54.

