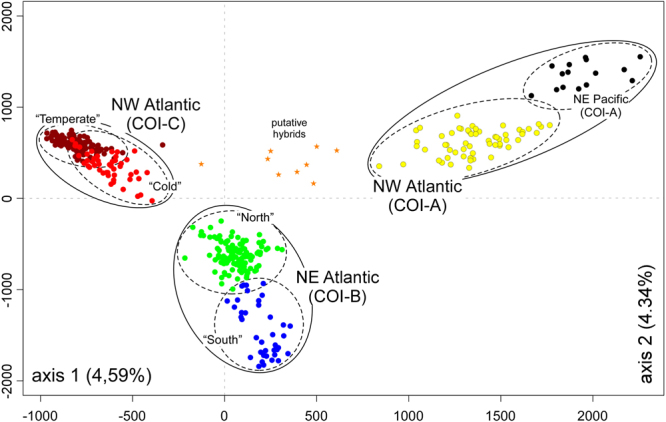
Figure 4.

FCA plot based on all individual multilocus genotypes of S. latissima s. l. Solid lines denote mtDNA phylogroups (note the correspondence with microsatellite-based genotypic clusters) and dashed lines further geographic sub-divisions inferred with genotypic data alone. All putative hybrids were detected in NW Greenland (NW Atlantic) within mixed COI-A/COI-C populations. The “temperate” COI-C outlier could result from backcrossing, genotyping error, or other.
