Figure 5.
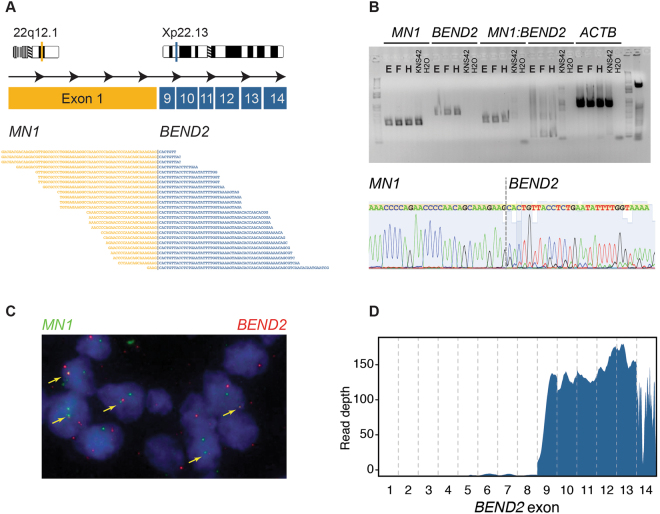
Identification of MN1:BEND2 fusion. (A) Cartoon of fusion between exon 1 of MN1 (22q12.1, orange) and exons 9–14 of BEND2 (Xp22.13, blue), with spanning reads from RNAseq from sample (F) underneath. (B) Top: RT-PCR using primers designed against MN1, BEND2, and spanning the breakpoint, in samples (E), (F) and (H). KNS42 paediatric glioblastoma cells were used as a fusion-negative control. Beta actin (ACTB) was used as a positive RT-PCR control. Bottom: Sanger sequencing of the fusion band in sample. (E) Showing a sequence spanning the breakpoint. (C) FISH using probes directed against MN1 (green) and BEND2 (red), detecting fusion signals throughout sample (H). (D) RNAseq coverage of BEND2, with high levels of expression of exons 9–14 in sample (E).

