Figure 6.
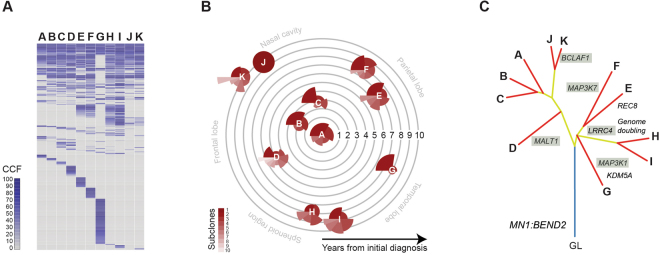
Intratumoral heterogeneity and phylogentic reconstruction. (A) Contingency plots for cancer cell fractions (CCF) of somatic mutations identified in specimens (A–K). Key as provided in the figure. (B) Coxcomb plots for number of subclones in each specimen, with the area of each scaled according to the number of variants predicted to be contained within, as calculated by EXPANDS. They are placed along concentric circles according to the sampling time after initial diagnosis, and in distinct anatomical locations. (C) Phylogenetic tree of tumour specimens built using maximum parsimony from exome sequencing data. Blue line represents the ‘trunk’, yellow lines the shared major and minor ‘branches’, red lines the private ‘leaves’. Selected alterations are labelled, those targeting the NF-κB pathway are shaded.

