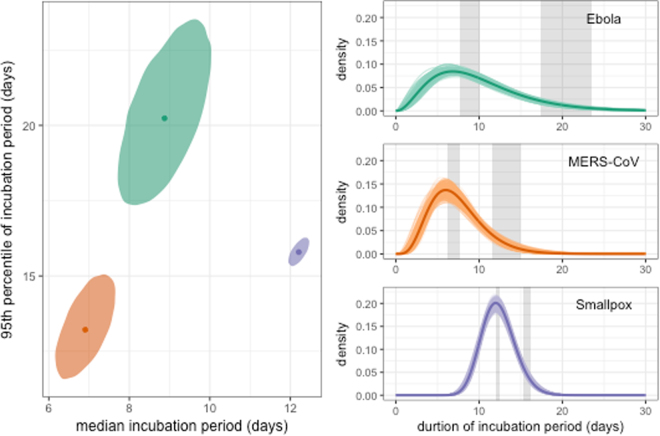
Figure 2.
Estimates and credible regions for incubation period distributions for Ebola, MERS-CoV and smallpox. The shaded elliptical areas represent regions that contain 95% of the estimated posterior distributions for each of the three diseases. The disease-specific curves plotted on the right show the estimated distribution for the incubation period for each disease (dark line). To show some of the uncertainty associated with these estimates, a random selection of density functions sampled from the joint posterior are represented by colored transparent lines around the heavy lines. Shaded vertical bands indicate the marginal credible regions for the median and 95th percentile.

