Fig. 1.
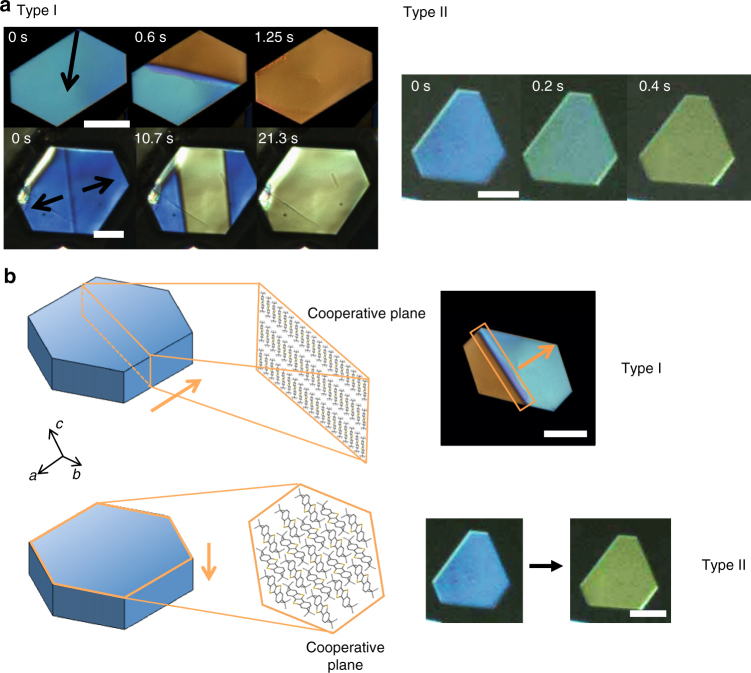
Martensitic transition in ditBu-BTBT single crystals. a POM images of ditbu-BTBT single crystals displaying Types I and II transition from LT (blue) to HT (yellow). The arrows in Type I panel indicate direction of movement of the phase boundary line between LT and HT forms. Top and bottom scale bars correspond to 100 and 25 µm, respectively. Type II transition exhibits a uniform change in birefringence across the entire crystal surface. Scale bar corresponds to 25 µm. b Schematic of the cooperative molecular planes (enclosed molecules) involved in Type I and Type II transitions. The two types are differentiated in terms of the direction of phase boundary propagation. Top and bottom scale bars correspond to 100 and 25 µm, respectively

