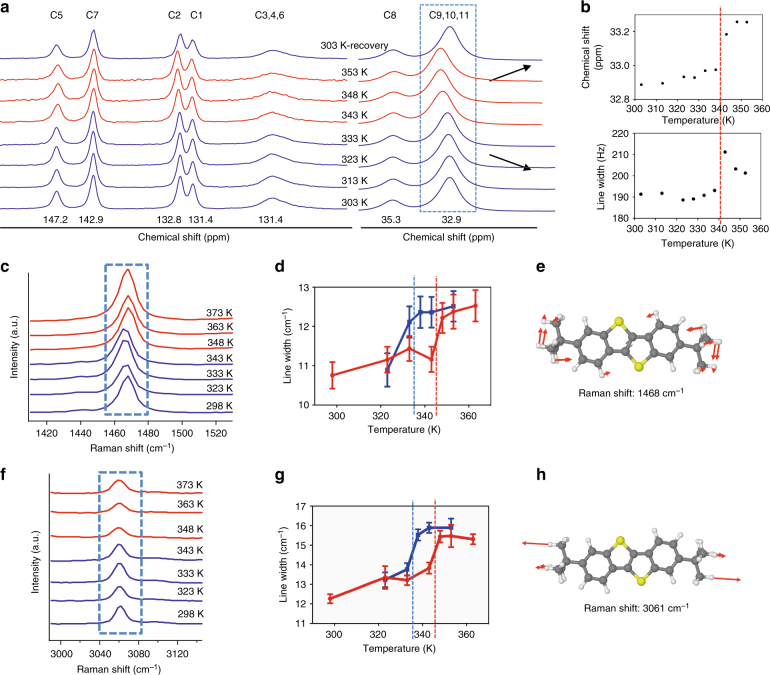
Fig. 3.
Experimental evidence showing side chain disorder in ditBu-BTBT. a Variable temperature NMR spectra of ditBu-BTBT powder sample. Blue and red spectra correspond to LT and HT forms, respectively. The peak that corresponds to 32.9 ppm was identified as the side chain carbons, C9, C10, and C11. b Both the chemical shift position and the linewidth of the side chain carbons show a clear increase near the predicted transition temperature from DSC (red dashed line). c Variable temperature Raman spectra for Raman shift 1468 cm−1. d Plot of linewidth as a function of temperature for Raman shift 1468 cm−1. e DFT predicted vibrational mode showing C-H bond bending in the side chains. f Variable temperature Raman spectra for Raman shift 3061 cm−1. g Plot of linewidth as a function of temperature for Raman shift 3061 cm−1. h DFT prediction showing C-H asymmetric stretching in the side chains. Blue and red spectra correspond to LT and HT forms, respectively. A clear increase in the linewidth is observed at the predicted transition temperatures for both Raman shifts (red dashed line: onset transition temperature during heating, blue dashed line: onset transition temperature during cooling). The error bars are calculated from the Gaussian curve fitting of the Raman spectra

