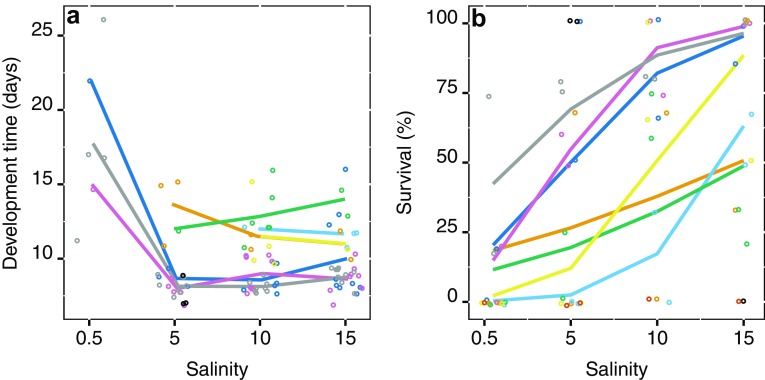
Fig. 5.
Response to salinity of the separate genotypes from the GOR population, a show adult development time, where points are development time per individual, and b show adult survival where points are average survival per vial. Color coding is the same in both panels; points show every genotype, while lines show the genotypes that have estimates across salinity

