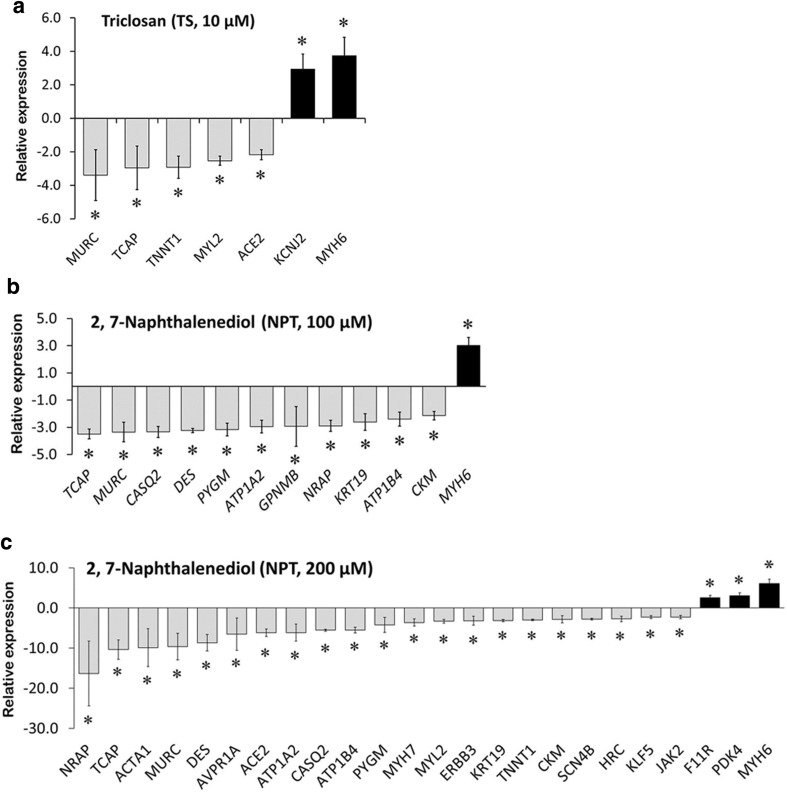
Fig. 4.
Relative gene expression studies using qPCR. Significant differential expression of genes by TS at 10 µM (a), NPT at 100 µM (b), and NPT at 200 µM (c). Bar graph shows the fold change differences in expression levels of target genes between control and compound-exposed cardiomyocytes (mean ± SD, n = 3, *p < 0.05, fold change ≥2.0)

